Read a sync result
This page explains every part of the screen, top to bottom.
The summary cards
Five cards sit above the table. They follow your filters — change the time range or pick one connector, and the cards recalculate for that selection.

| Card | What it counts |
|---|---|
| Sync events | Runs in the current selection |
| Success rate | Share of those runs that did not fail. A partial run counts toward it |
| Records synced | Items collected across those runs |
| Partial syncs | Runs that collected some of their data but not all |
| Failed syncs | Runs that collected none |
Success rate is colored: green at 50% or above, amber between 25% and 49%, red below 25%.
The rate counts runs that failed. A partial run collected data, so it does not lower the rate. 100% means nothing failed outright — read Partial syncs alongside it to see whether everything was complete.
A partial run collected most of your data. A failed run collected none. They are different events, so they get their own cards — a connector with partial runs is not the same as a connector that is down.
The table
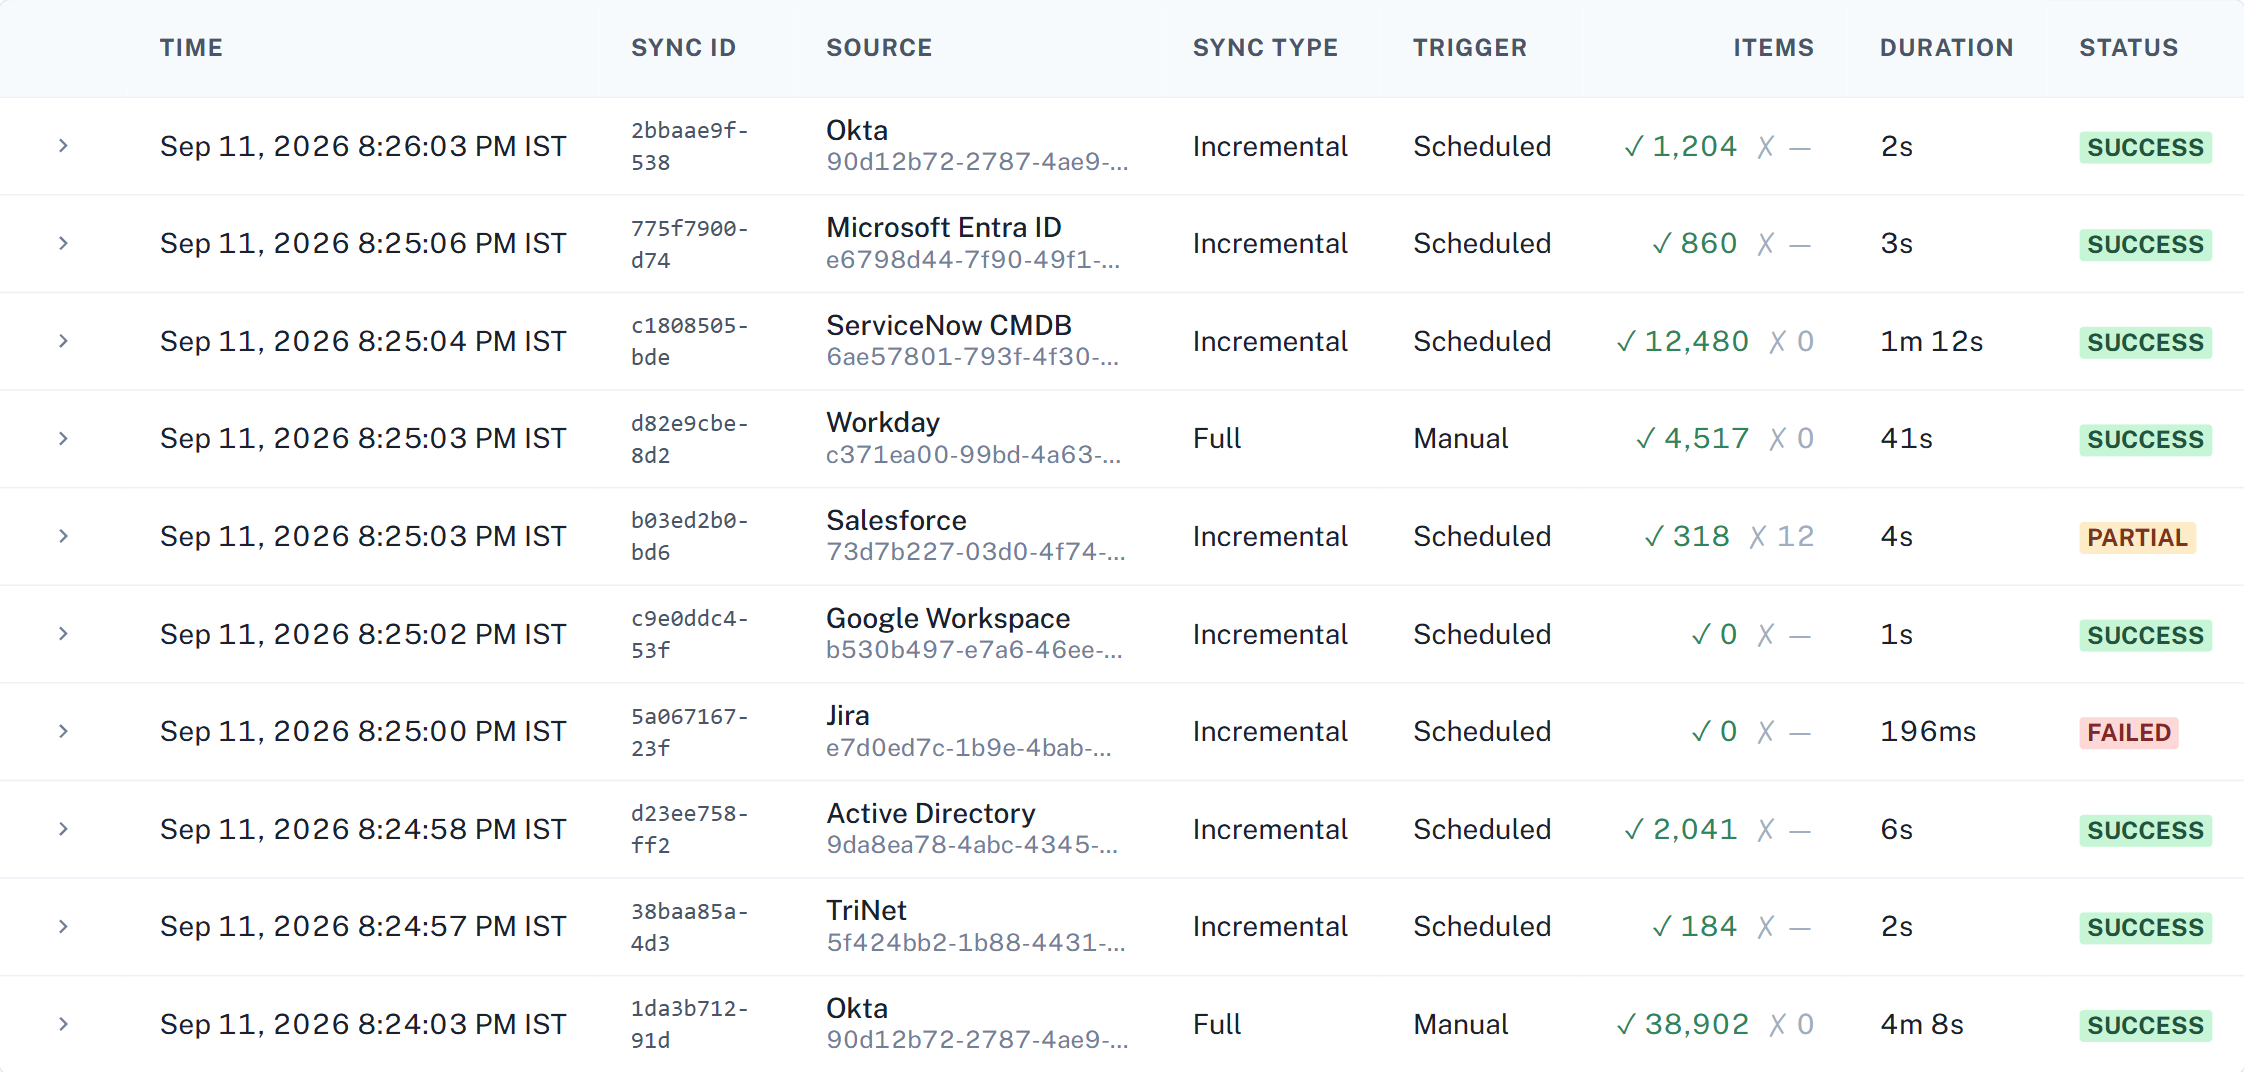
| Column | What it shows |
|---|---|
| Time | When the run started. Shown in UTC or your own timezone, whichever your tenant is set to — the zone is written next to the time |
| Sync ID | Identifier for this run — quote it when you contact support |
| Source | The connector name you gave it, and its identifier |
| Sync type | Full, Incremental, or Other |
| Trigger | Whether the run was started manually or on a schedule |
| Items | How many records the run attempted, succeeded and failed |
| Duration | How long the run took |
| Status | The outcome |
Select the arrow at the start of any row to expand it.
Statuses
| Status | Meaning | Your action |
|---|---|---|
| Success | Everything the run set out to collect arrived | None |
| Partial | Some of the data arrived, some did not | Check what was missed |
| Failed | The run collected nothing | Find the reason |
| In progress | The run has started and has not finished | Wait |
| Completed | The run finished without reporting a per-category outcome | None |
| Interrupted | The run started, never reported a finish, and is now more than 24 hours old | Re-run it |
Each row keeps the outcome that run had at the time it ran. Mesh does not recalculate it later, so an old run keeps its original status even after the cause is fixed. Only runs that start after the fix show the new behavior.
Failed means Mesh tried and could not collect. Interrupted means Mesh never heard how the run ended — most often because the service restarted while it was running. The data it collected before that point is kept.
Item counts
The Items column reports up to three numbers for a run:
| Number | Meaning |
|---|---|
| Attempted | How many records the source said it had |
| Succeeded | How many records reached Mesh |
| Failed | The difference between the two |
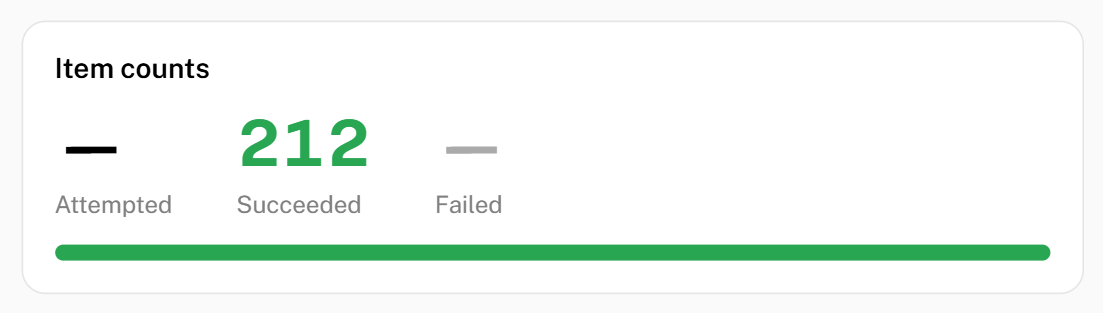
A dash is not a zero
Some connectors report all three numbers. Most report only Succeeded, because their source never states an intended total.
Where a number is not reported, the screen shows a dash:
Not reported by this connector type — it does not provide this number, so the field is left blank rather than shown as 0.
A dash means "unknown", not "none". A run showing — / 1,204 / — collected
1,204 records successfully. It does not tell you that nothing failed — this
connector reported neither Attempted nor Failed, so both are unknown.
A real zero is still shown as 0. If a connector reports that 40 records
failed, you see 40.
Filters

| Filter | Options |
|---|---|
| Search | Match on source or identifier |
| Sync type | All sync types, Full, Incremental, Other |
| Status | All statuses, Success, Partial, Failed, In progress |
| Time range | Last 24 hours, 7 days, 30 days, 90 days |
The table and the summary cards both follow the filters.
The expanded row
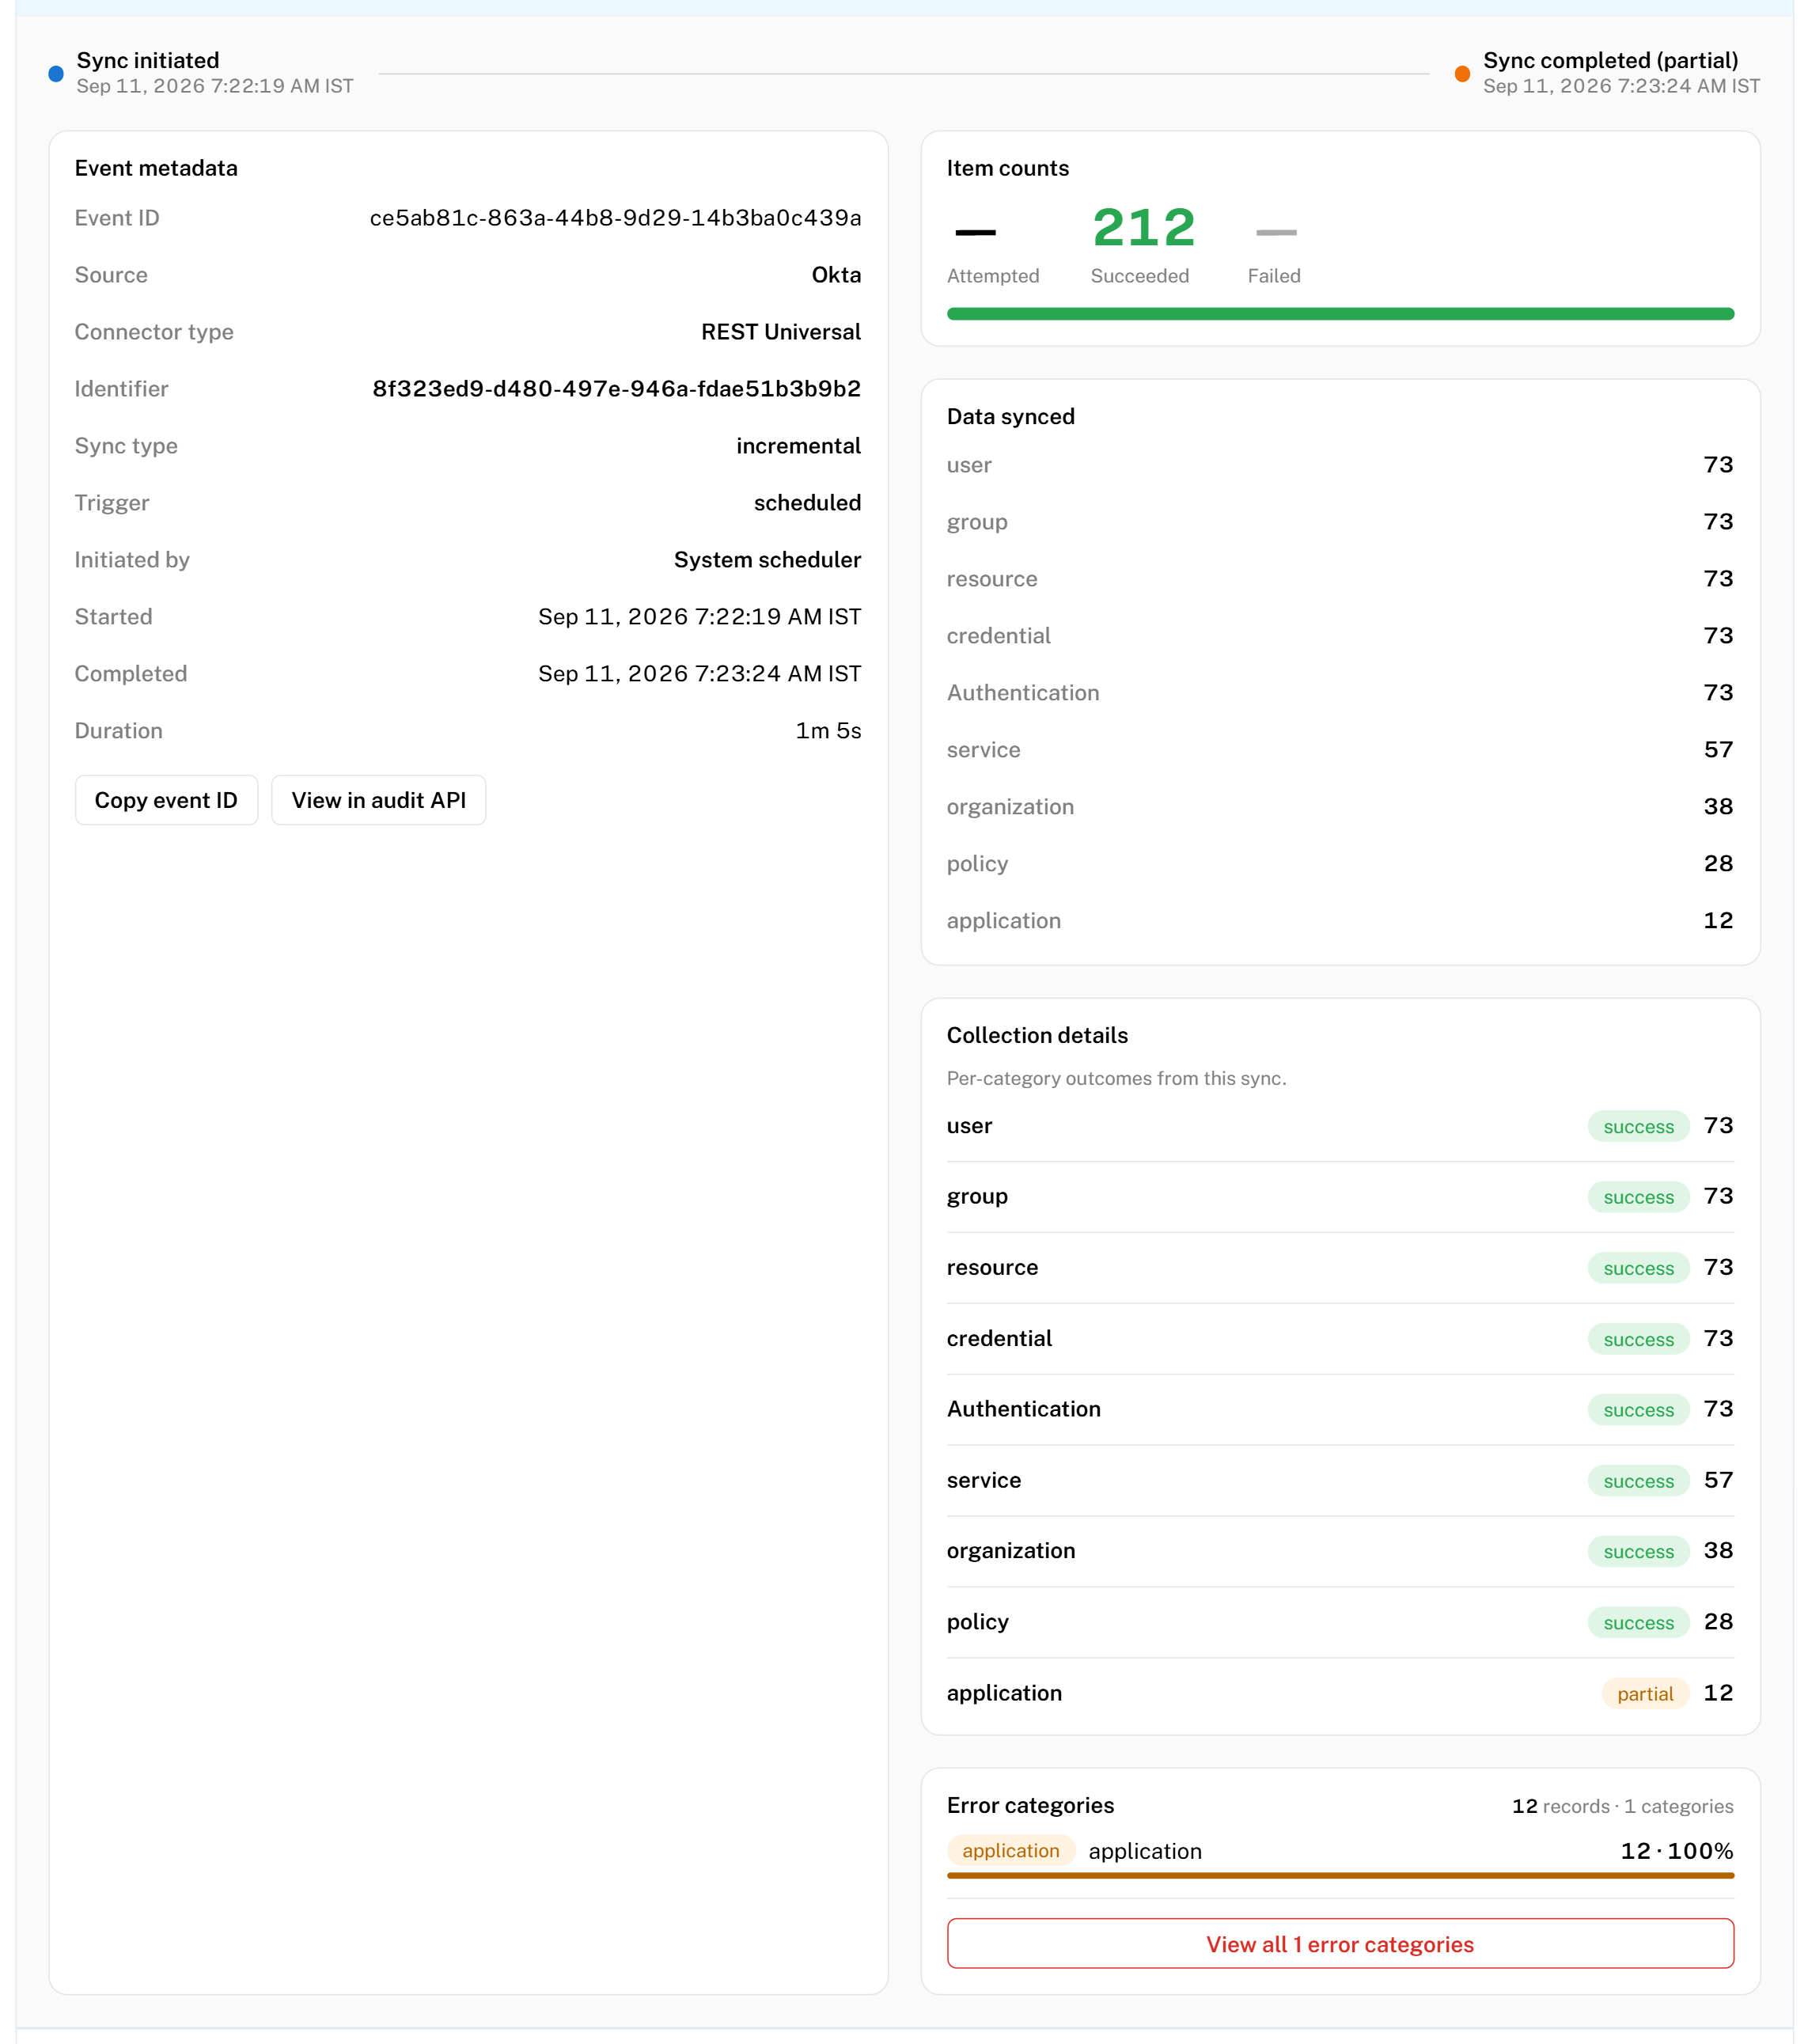
Expanding a row shows what the run did in detail:
- Item counts for the run, with the dash explained on hover.
- Data synced — the categories of data the run collected.
- Failure detail, for a run that failed or partly failed. You can search, sort and page through the individual failures behind a single run.
Export
Select the download icon to export to CSV.
The export covers every row matching your current filters, not just the page on screen. A notification confirms how many events were exported.
Times in the export are always UTC, even when the screen is showing your own timezone.
The button is disabled while an export runs, so you cannot start a duplicate by accident.