Working with widgets
Every panel on a composed workspace is a working widget, not a picture of one. What you can do depends on what it draws: a table's rows can be searched, sorted, filtered and exported, most widgets can be renamed, resized and redrawn as a different kind of chart, and any widget can be removed — all without leaving the canvas or starting a new workspace.
Two routes reach the same controls. Use the widget's own header if you know what you want to change, or ask the AI chat if you would rather describe it. Neither is a shortcut for the other: the chat performs the same actions you would perform by hand, and the results are identical.
The widget header
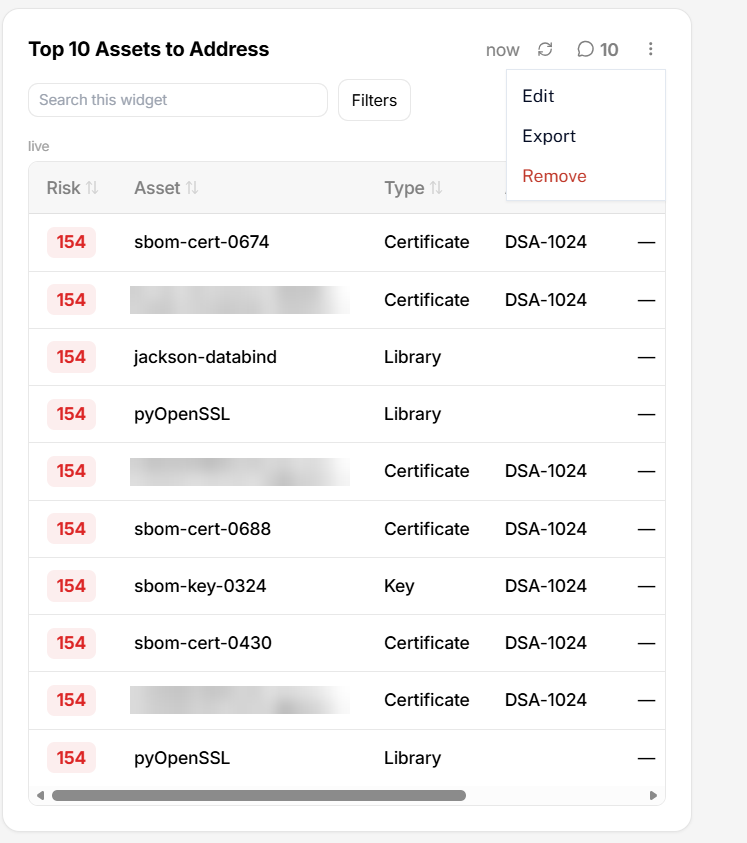
Every widget carries the same controls in its top-right corner.
| Control | What it does |
|---|---|
| Refresh | Asks the widget for its data again. A widget backed by a live query re-runs it; a widget holding a fixed set of rows — a chart composed from chat, for instance — redraws the rows it already has. |
| Chat | Opens a chat thread scoped to this widget alone. |
| Three-dot menu | The vertical ⋮ button. Opens Edit, Export, and Remove. |
The time shown beside these controls is when the widget was last loaded or refreshed on your screen. It is not a statement about when the underlying data last changed.
Finding the rows you want
Table widgets carry a search box, sortable column headers, and a Filters control. How far they reach depends on the widget: on some, the search or filter is answered by the server and looks at every row behind the widget; on the rest it narrows the rows the widget has already loaded. Mesh tells you which one you have rather than leaving you to guess — see the search box wording below.
Search
Type into the search box to match against the widget's name column. The match is anywhere in the value, and case does not matter.
The label tells you how far the search reaches. A box reading Search this widget asks the server and matches every row behind the widget, whether or not it is on screen. A box reading Search loaded rows matches the rows the widget has already fetched. Hovering either one spells out the same distinction.
Every table widget has a box. A widget that draws a single number or a summary has nothing to search, so it shows no box rather than a box that does nothing.
Sort
Select a column header to sort by it, and select it again to reverse the direction. Columns that can be sorted show the sort arrows beside their label.
Filter
Select Filters to build a condition. Choose a Field, a Condition, and a Value, then select Add filter. Each filter you add becomes a chip above the list, and Clear filters removes them all at once.
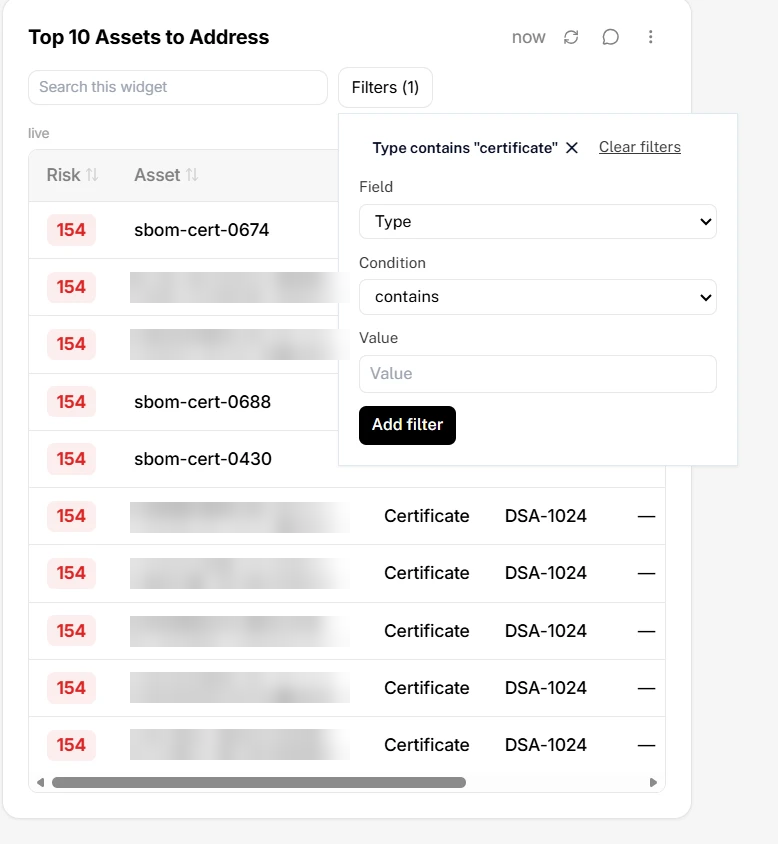
A filter reaches as far as the widget's data source allows, the same way search does. On most widgets it narrows the rows already loaded, so a filtered Top 10 can come back with fewer than ten rows even though more than ten match — the filter is choosing among the ten, not re-ranking everything behind them.
Where the data source filters for itself, the Field list offers only the columns it can genuinely answer on. A column that is displayed but cannot be filtered is left out rather than offered and silently ignored.
Changing how a widget looks
Open Edit from the three-dot menu to rename a widget, resize it, change how its data is drawn, and choose which columns a table shows.
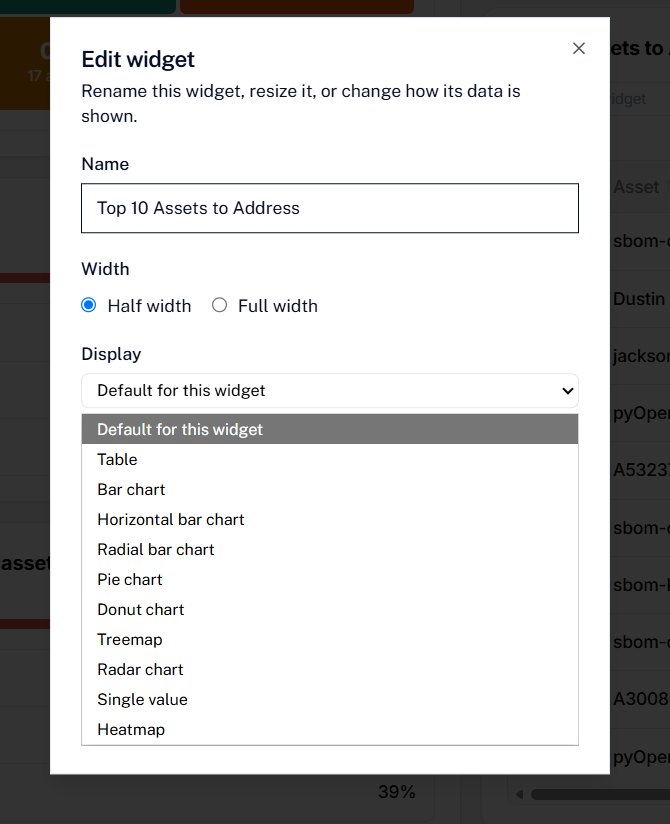
- Name — rename the widget. Leave it empty to go back to its default name.
- Width — Half width or Full width on the canvas.
- Display — the chart or table this widget is drawn as.
- Columns — which columns a table widget shows, for table-backed widgets.
The Display list is built for each widget
The displays offered are the ones this widget's own data can actually fill. A list of assets with a category and a count can be drawn as a bar chart, a pie, a donut, or a treemap; a single measured number cannot, so those options are not offered for it. You will see different choices on different widgets, and that is the data talking, not an inconsistency.
Default for this widget is always the first entry, and choosing it puts the widget back the way it was composed.
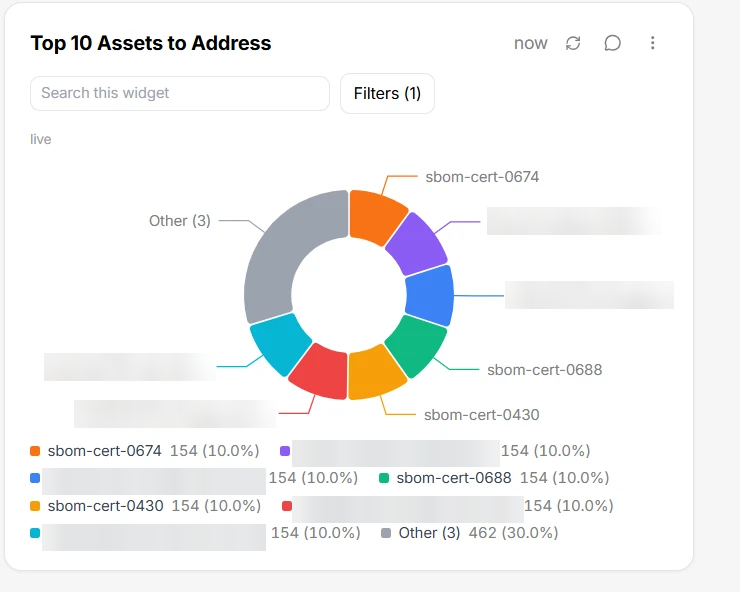
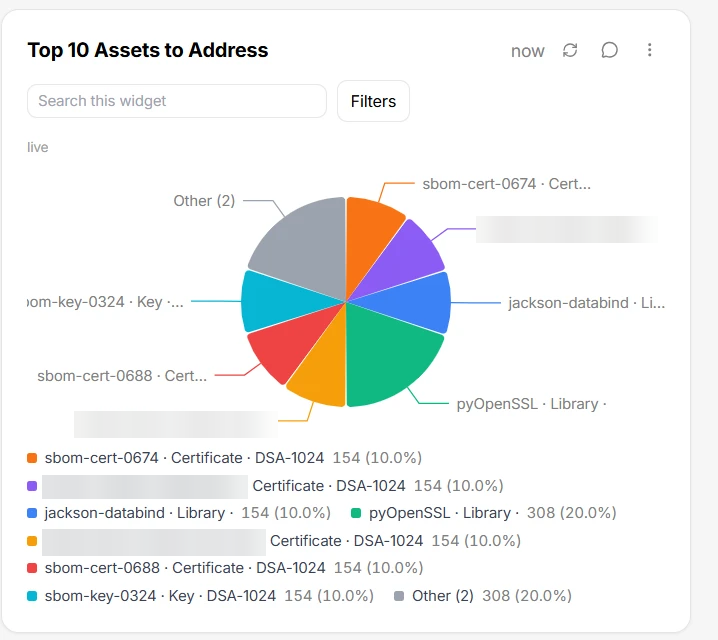
Some displays stay readable only up to a point — a pie of four hundred slices tells you nothing. Where that applies, the widget draws the largest rows and says on the card how many it is showing out of how many there are. Nothing is hidden from you silently.
Changing a display keeps the widget's data, filters, search term, title, size, and position. You are changing how the same rows are drawn, not asking a new question — so a filtered table that you redraw as a pie chart is a pie chart of exactly the rows you had filtered to.
Exporting a single widget
Open Export from the three-dot menu to download what the widget holds as a CSV file. Mesh asks which rows you want:
| Scope | What lands in the file |
|---|---|
| Visible rows | Exactly what is on screen, in the order and columns you are looking at. |
| Filtered results | Every row matching your current filters and search, not just the loaded page. |
| All results | The full dataset behind the widget, ignoring your filters. |
Filtered results and All results are offered only on widgets whose data source can serve them. If the dialog shows you Visible rows alone, that is the whole of what this widget can export.
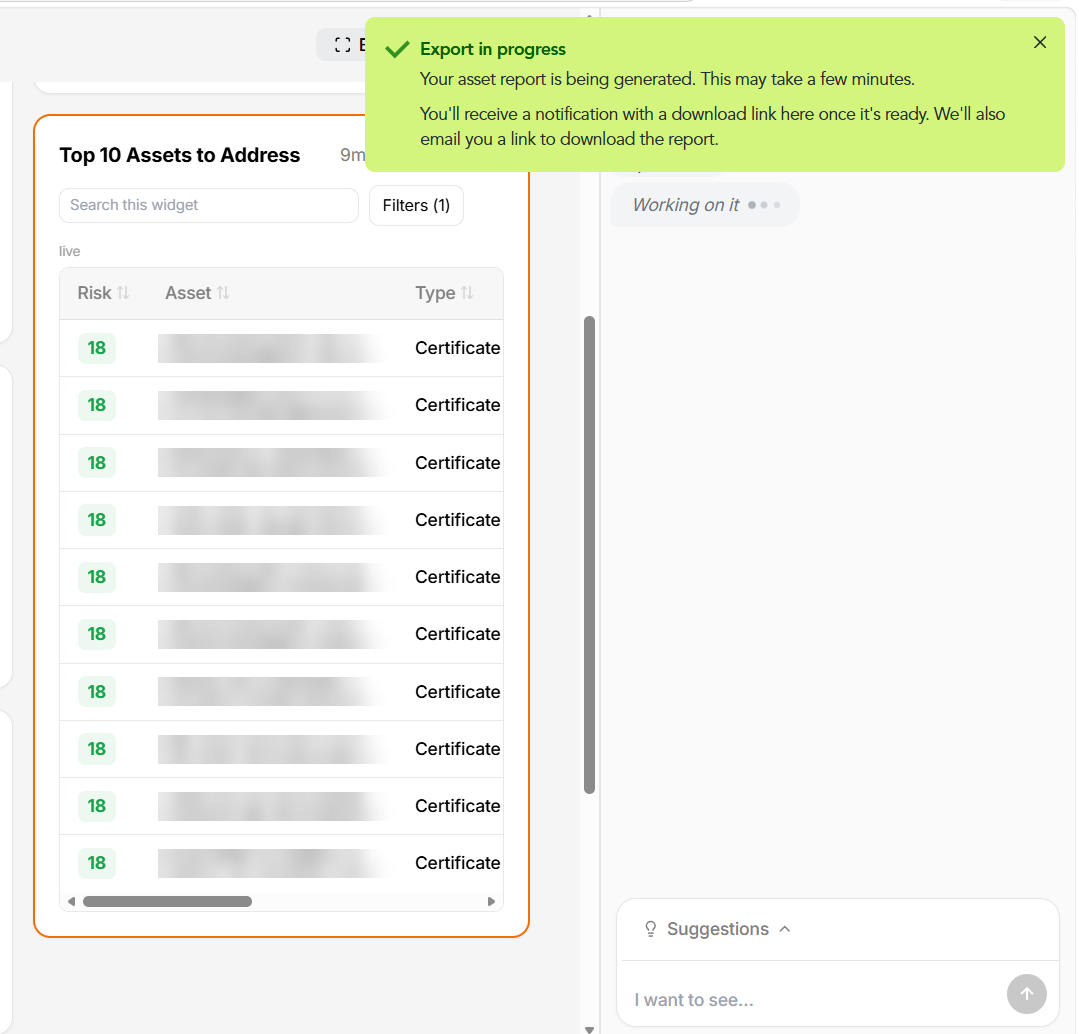
A few things worth knowing before you rely on an export:
- A summary widget exports the summary, not the records behind it.
- Every export is recorded in the audit log, attributed to whoever ran it.
- Exported timestamps are always UTC, whatever your tenant's display preference. See Reports and exports for the full export story, including FAIR reports and bulk retrieval.
Removing a widget
Open Remove from the three-dot menu to take a widget off the canvas. It is available from the menu in normal view — you do not need to enter an edit mode to reach it.
You can also remove a widget from its own chat thread, which offers Remove this widget from the view and asks you to confirm before it acts.
Asking the chat instead
Every action above can be requested in plain language. Use the widget's own chat thread when you mean this widget, and the workspace chat when you mean the canvas as a whole.
| Ask for | What happens |
|---|---|
| "Export this widget" | Mesh runs the export and tells you what it started. |
| "Remove this widget" | Mesh removes it, after confirming with you. |
| "Convert this widget to a treemap" | Mesh redraws the existing widget in the display you asked for. |
| "Add a pie chart of this data" | Mesh composes a second widget presenting the same data that way, beside the original. |
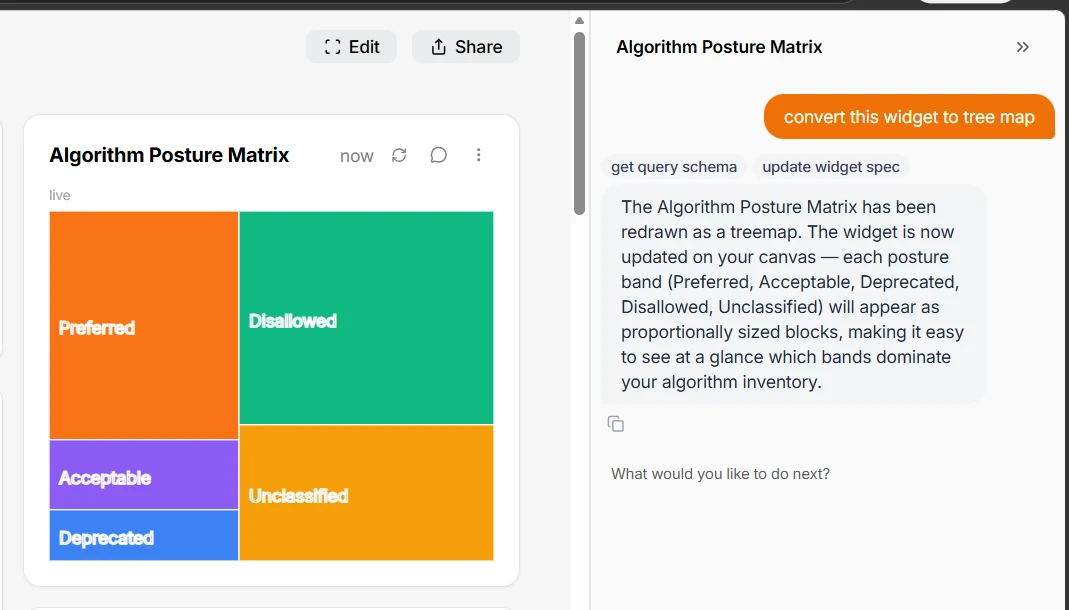
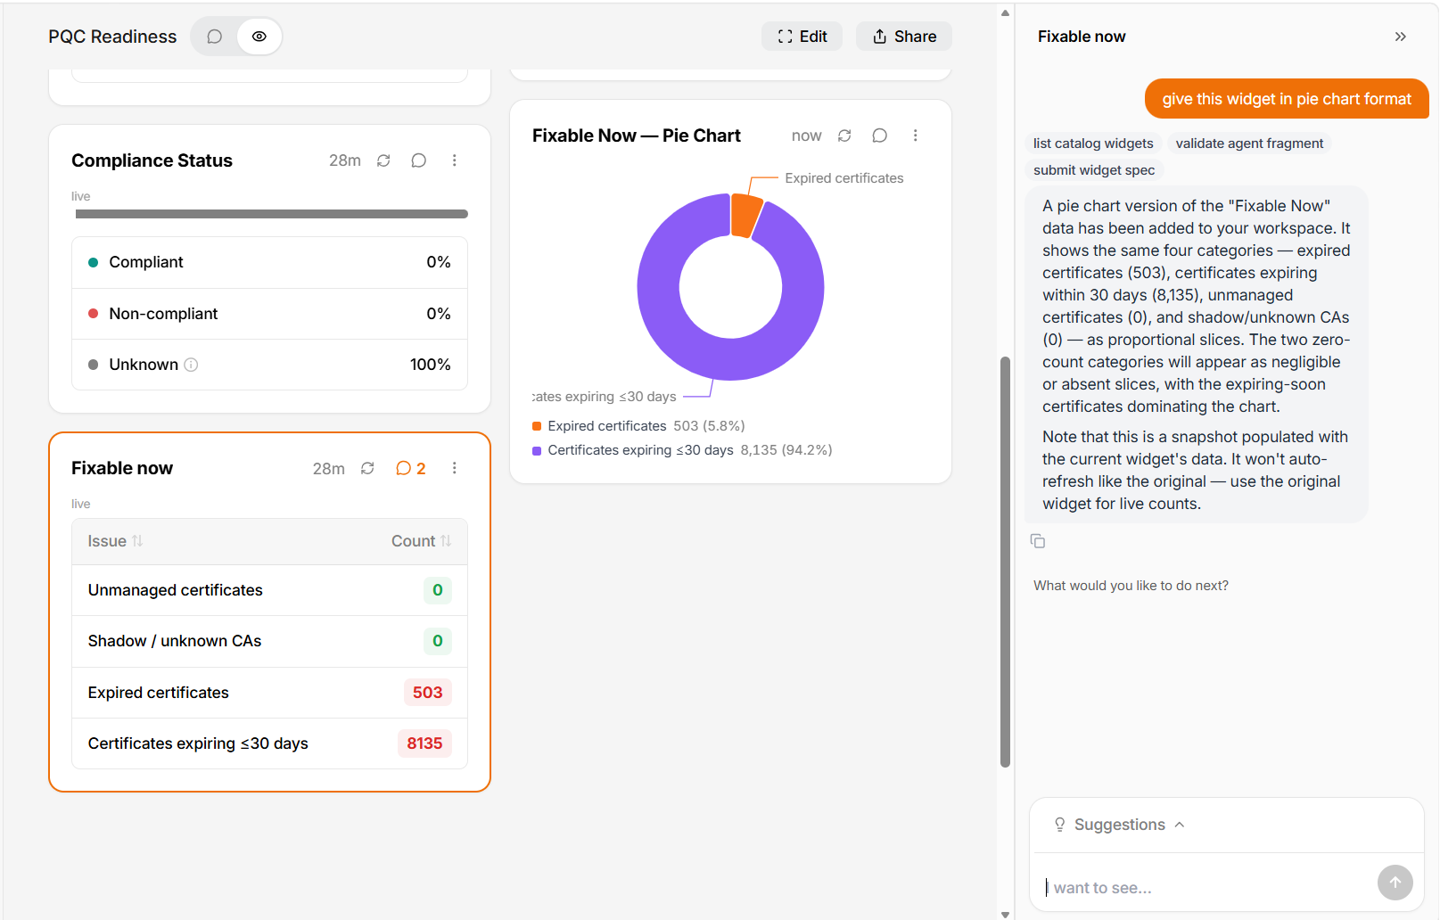
Two habits make the chat much more useful:
- It tells you what it actually did. When a request succeeds it says so and names the widget; when it fails it says that instead. It does not announce a download or a change that did not happen.
- It declines what it cannot do. A refusal with a reason is the assistant working correctly, not a fault. If it says a widget cannot be drawn a particular way, that widget's data genuinely cannot encode it.
Going deeper into a row
Selecting a row, a slice, or a node opens a focus view about that one thing. Those views carry their own search, filters, columns, and Export, and they stack so you can follow a thread several steps and come back. See Drill-downs and more panels.
Related:
- Generative UI overview — composing a workspace and what it will and will not do
- Drill-downs and more panels — focus views and the panels you can ask for
- Reports and exports — FAIR reports, the Analytics OData API, and bulk retrieval