PQC dashboard: The crypto-vulnerable asset overview
Axiad Mesh tracks the machines, software, and cryptographic assets in your environment and their exposure to post-quantum cryptography (PQC) risk. The Crypto-vulnerable asset overview — the PQC dashboard — is where you browse those assets, understand why each one carries risk, and act on what you find.
Two dashboards, one switch
Mesh has two primary dashboards:
- Identity risk assessment — human identities: the people in your organization and the accounts, credentials, and entities correlated to them.
- Crypto-vulnerable asset overview (the PQC dashboard) — the machine, software, and crypto assets in your environment and the risks they carry.
Mesh takes your organization straight to the one it works in most, so nobody has to choose a dashboard on every visit. That happens once, at sign-in. From there, the selector in the header moves you between them as often as you like. To set or change your organization's default dashboard, contact Axiad support.
Alongside these classic dashboards, Mesh offers a newer, agentic experience. A Try the new experience banner opens it, and Switch to Classic View in your avatar menu brings you back. See Generative UI.
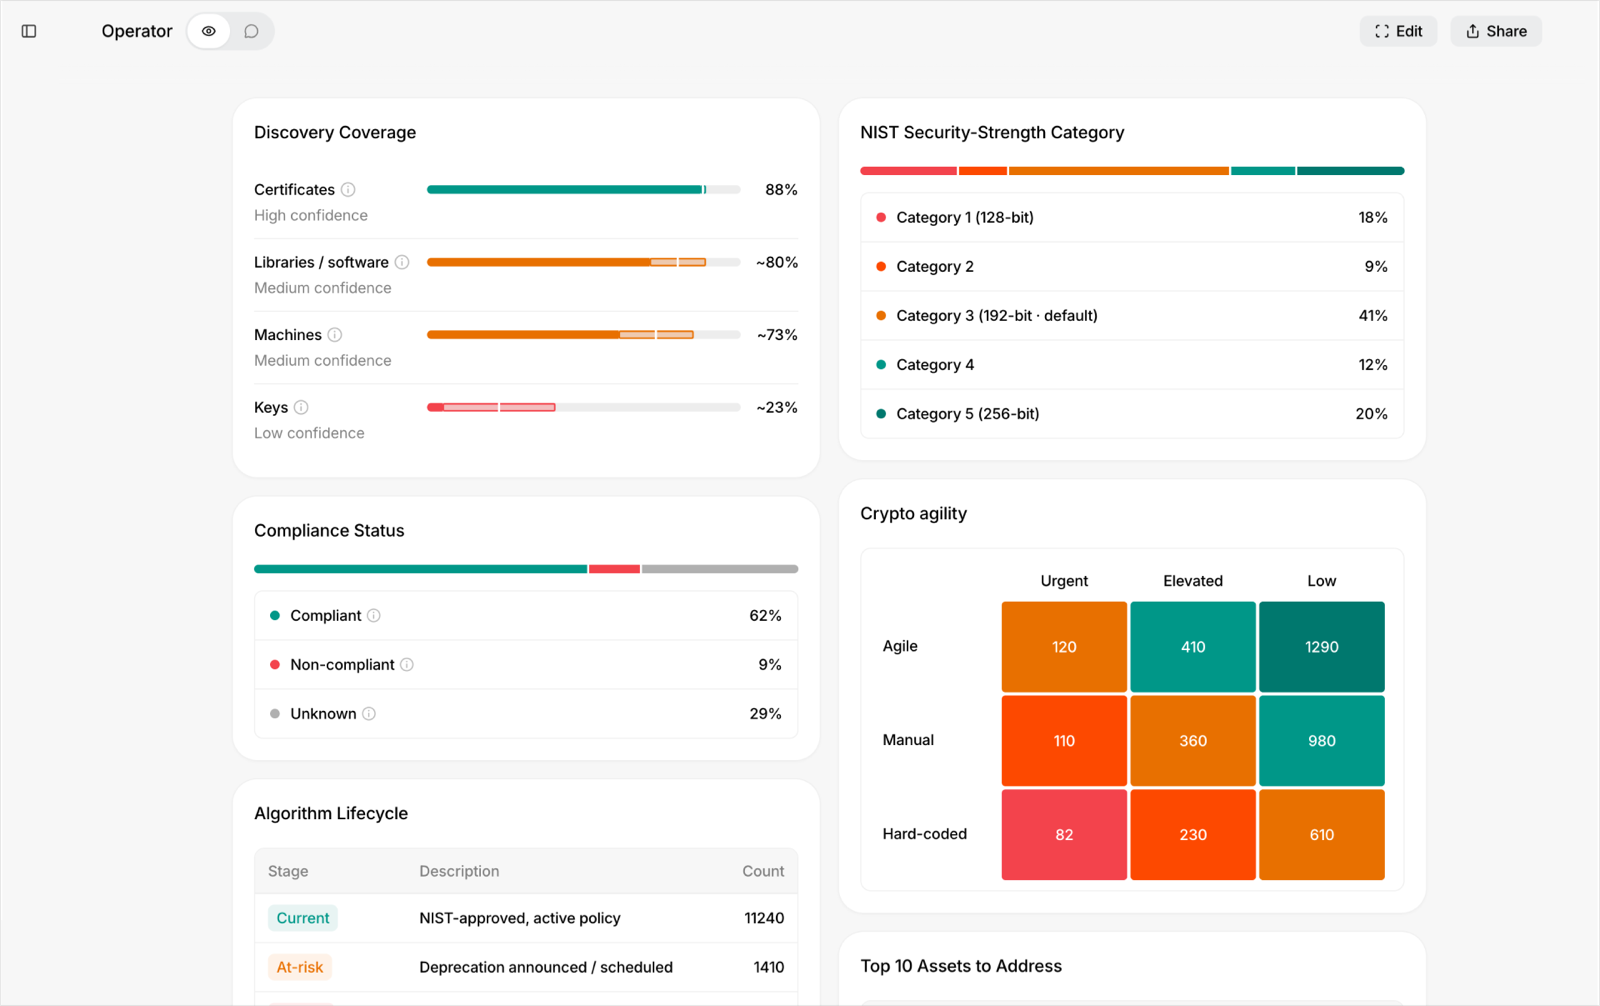
In Agentic mode, the same crypto estate can be composed as a workspace — for example an operator view with discovery coverage, compliance status, algorithm lifecycle, and crypto-agility breakdowns:
Algorithm Posture Matrix
At the top of the Crypto-vulnerable asset overview, the Algorithm Posture Matrix answers one question at a glance: of all the cryptographic assets Mesh has discovered in your environment, how many use algorithms your policy considers good, aging, or unacceptable?
Every discovered asset is graded into one of four tiles. The examples below are illustrative — the algorithms that land in each tile depend on your own policy:
| Tile | What it means | Examples |
|---|---|---|
| Preferred | The best available choice under your policy — typically hybrid and post-quantum schemes. | ML-KEM combinations |
| Acceptable | Meets your policy's minimum today, but isn't the target state. | AES-256, RSA-4096, SHA-256 |
| Deprecated | Still allowed, but being phased out. Plan a migration. | 3DES, SHA-224 |
| Disallowed | Violates your policy outright. | MD5, SHA-1, AES-128 |
The number on each tile is the count of distinct assets in that category. Select a tile to open a drill-down that lists which algorithms make up the category and the assets using each one.
The Disallowed tile corresponds to the Prohibited level in your crypto compliance policy.
Where the grades come from
The four categories are not a fixed industry list — they are read directly from your organization's active crypto compliance policy. Mesh grades each asset's algorithms against that policy and counts the results, so two organizations looking at identical assets can see different numbers if their policies differ.
Key size is part of the grade, not just the algorithm name. RSA-2048 and RSA-4096 are the same algorithm but land in different tiles when your policy sets a minimum strength — for example, a policy with a 3072-bit floor grades RSA-2048 as Disallowed and RSA-4096 as Acceptable.
How to read the counts
- Preferred can legitimately read 0. The matrix counts only the algorithms Mesh has actually observed on your assets. A zero means no preferred algorithm has been detected in your environment — not that the tile is broken.
- Algorithms your policy doesn't classify are left out of all four tiles rather than being assigned to a category they don't belong in. The tile counts therefore cover only the algorithms your policy grades.
- The matrix covers crypto and software assets. Machine assets are not included in these counts.
- If your organization has no active crypto compliance policy, or no data has been collected yet, the matrix reports that a data refresh is in progress instead of showing counts.
To change how algorithms are graded — different levels, different key-size floors, different deadlines — contact your Axiad representative.
Asset types
The asset inventory covers three asset types, each with its own tab in the asset list. The same three types are available programmatically through the Analytics OData API:
| Asset type | What it covers | OData entity set |
|---|---|---|
| Machine | Machines in your environment; key attributes include the operating system version | MachineAssets (entity type MachineAsset) |
| Software | Software products, with a version and a normalized product name | SoftwareAssets (entity type SoftwareAsset) |
| Crypto (certificate) | Certificates and other cryptographic elements | CryptoElements (entity type CryptoElement) |
The API goes further than the three asset lists shown here. It also exposes the structure behind your software inventory — the dependencies between components, and the cryptographic elements associated with each component — which the dashboard does not surface as its own list. See Reports, exports, and data retrieval for the full entity set list.
Where asset data comes from
Mesh builds one inventory from the sources your organization connects. Today there are two, and each asset carries the identity that matches the source it came from:
| Source | What it reports | Identity the asset shows |
|---|---|---|
| ServiceNow CMDB | Software, certificates, and machines your CMDB records | ServiceNow ID, and a link that opens the record in ServiceNow |
| SBOM or CBOM feed | Components and cryptography declared inside a project your own SBOM tool scanned | Package URL and SBOM Projects |
That pairing is what lets you trace any row back to the system that reported it, in the vocabulary that system uses.
These are two independent accounts of your estate, and Mesh keeps them independent on purpose. When the same package is reported by your CMDB and by an SBOM, you get a record from each rather than one blended row, so you can see exactly what each source knows about it. Both records are listed, counted and exported in their own right.
Which identity an asset shows
An asset shows SBOM identity when its data carries the coordinates that make that identity meaningful: a Package URL for software, or membership of a scanned project for cryptography. Records inventoried from your CMDB show their ServiceNow identity.
A few things that shape what you see:
- A Package URL is optional in an SBOM. Documents describing internal applications, container images, or cryptography alone often leave it out, and Mesh ingests those components either way so nothing from the scan is lost. Emitting Package URLs from your SBOM tooling gives those components their full SBOM identity in Mesh, and lets them group with matching records.
- Some feeds report a flat list of components rather than a scanned project. Those records carry a Package URL and no SBOM Projects value.
- Cryptographic elements qualify a little differently, because a certificate or an algorithm is not a package and has no Package URL of its own. A crypto element takes SBOM identity when it belongs to a scanned project or sits under a component.
- The SBOM features can be switched on or off per organization. They are on by default; an administrator can check Settings → General → SBOM Dependency Graph.
The points above explain why individual assets differ. If no SBOM data appears anywhere — no Package URLs, no projects, no dependency graph — the place to start is your SBOM connector's most recent run. Contact Axiad support with the connector name and the time of the last sync, and we'll take a look.
The asset list
Each asset type has its own tab: Software, Crypto, and Machine. The three lists share a layout — a risk score, a set of columns, and a row menu — but they don't carry the same columns, and only the Software list groups its rows.
Columns
Every list opens with Risk score and ends with a row-actions menu. The columns between them depend on the asset type.
On all three lists
| Column | What it shows |
|---|---|
| Risk score | The asset's score. Point at it for the breakdown described in Risk score breakdown |
| Asset | The asset name, plus any badges. For a machine with no recorded name, Mesh falls back to the machine's ID in the source system |
| Status | The asset's lifecycle state. See Status |
| Owner | The owner's name, with their email beneath it |
| Owning group | The group that owns the asset |
| Organization | The owning organization or department |
Software only
| Column | What it shows |
|---|---|
| Version | The version of the software (for example, 2.3.1) |
| Publisher | Who published the build. Mesh also uses this to decide whether two records describe the same software — see Why some rows are grouped. Blank when the source didn't supply a supplier |
| Platform | The platform the software runs on |
| Installed machines | How many machines carry this software. On a grouped row this counts distinct machines across the whole group, so a machine hosting two records in the group is counted once |
| Product | The normalized product name. A value that is only an opaque identifier is hidden here, because this column is meant to name a product |
Crypto only
| Column | What it shows |
|---|---|
| Signature algorithm | The signing algorithm, combined with the hash — for example, RSA-SHA256 |
| Public Key Algorithm | The public-key algorithm combined with the key size — for example, RSA-2048 or EC-P256. Shows Unknown when the algorithm wasn't reported |
| Installed on | The machine the cryptographic element was found on |
Machine only
| Column | What it shows |
|---|---|
| OS | The operating system |
| OS version | The operating system version (for example, 10.0.19045) |
| Manufacturer | The machine's manufacturer |
Each row also carries its risk tags beneath the columns, and ends with a menu offering View asset details, Delegate investigation (coming soon), and View this asset in ServiceNow (for assets that carry a ServiceNow ID).
When a value isn't available, the cell shows a dash (-). Values depend on
what your connected sources report, so a column can show a dash until the next
connector sync completes. A long value shows in full when you point at it.
The identifiers an asset carries — the one Mesh assigns and the one it has in the system it came from — are deliberately not columns. They appear on the asset details page instead; see How an asset is identified.
Sorting
Select a column header to sort by it, ascending or descending. Asset, Status, Owner, Owning group and Organization sort on every list, along with Version, Publisher, Platform, Installed machines and Product on Software; Signature algorithm and Installed on on Crypto; and OS, OS version and Manufacturer on Machine. On Crypto, sorting by Signature algorithm brings algorithm families together.
Each asset tab keeps its own sort state — sorting one tab doesn't affect the others — and your sort state is preserved when you page through results or navigate back in the browser.
Status
The Status column reports the asset's lifecycle state. It follows the identity columns — directly after Asset on the Crypto and Machine lists, and after Version and Publisher on the Software list. The available values differ by asset type:
| Asset type | Values |
|---|---|
| Software | Active, Inactive, Unknown |
| Crypto | Active, Expired, Revoked, Suspended, Unknown |
| Machine | Active, Retired, Unknown |
Assets with no reported state show Unknown, and Unknown always sorts last, keeping assets that need attention easy to triage.
For assets that came from an SBOM, status tracks your scans as well as your source systems. Each time a project is re-scanned, Mesh retires whatever the new scan no longer contains — software moves to Inactive, and the project's cryptographic elements move to Expired — so your inventory reflects the project as it stands today rather than accumulating everything it ever held.
For a crypto element, then, Expired carries either meaning: the certificate reached its expiry date, or the component has moved on from the project. The asset's SBOM Projects value and the date of your last scan tell you which.
Why some rows are grouped
The Software list collapses records that describe the same piece of software into a single row, so one component found in a hundred places reads as one line rather than a hundred. The Crypto and Machine lists never group — every row there is one record.
Grouping needs a Package URL to work from. Two software records are treated as the same software when a record carries a Package URL and all four of these match exactly:
- Package URL (purl) — present, and identical
- name
- version
- publisher (a missing publisher counts as its own value, matching other records that also have none)
Matching is exact, and deliberately case- and whitespace-sensitive — package
ecosystems treat Foo and foo as different packages, so Mesh does too.
Only software discovered through an SBOM carries a Package URL, so records inventoried from your CMDB each keep their own row. That is why one list can show grouped and ungrouped rows together: the two sources describe software in different vocabularies, and Mesh groups only where the coordinates are precise enough to be sure two records really are the same package.
The Package URL identifies the package, not the installation — a package installed in many places still collapses into one row, with the ×N badge telling you how many records it stands for.
On a grouped row:
| Value | How the group's value is chosen |
|---|---|
| Risk score | The highest score in the group. It is never averaged, so a group can never look safer than its worst member |
| ×N badge | How many records were collapsed into the row |
| Installed machines | Distinct machines across the whole group |
| Product, Owner | Every distinct readable value in the group — blanks are dropped, and Product also drops values that are only an opaque identifier. The cell abbreviates as first, second +N; point at it to see the full list |
| Everything else | Taken from one representative record — the highest-risk member of the group |
Grouping applies to what you see on screen. Exports never group: an exported file always contains one line per underlying record.
Badges on the asset name: P and xN
Two small badges can appear next to an asset's name in the list. Both are announced by screen readers, and pointing at one shows a short label — the fuller explanation is below.
| Badge | What it looks like | What it means |
|---|---|---|
| Project | A blue square containing the letter P | This software row is a top-level SBOM project — the thing your SBOM tool scanned — rather than one of the components found inside it |
| Occurrence count | A purple multiplication sign followed by a number, such as ×123 (written "x123") | ×123 means 123 records are represented by this one row. What is being counted depends on the screen — point at the badge and it tells you. |
The ×N badge counts something different depending on where it appears, so read its tooltip rather than assuming:
| Where you see it | What ×N counts |
|---|---|
| Software list | Records collapsed into this row — see Why some rows are grouped |
| Crypto list | Distinct active software records that reference this cryptographic element |
| Dependency graph card | Occurrences of the same component folded into one card |
| Versions in tenant | Records carrying this exact version |
A row shows the P badge only when three things are true at once: the SBOM features are enabled for your organization, the record is a top-level project, and Mesh holds a Package URL for it. The third condition is the one that most often explains a missing badge — a project whose SBOM didn't declare a Package URL is still a project, but carries no P.
Filters
A Filters button above each list opens the filter dialog. It has two tabs:
- Filters — the category filters (Risks, Platforms, Owners, Organizations, and Locations). These preview as you select them.
- Advanced — filters on individual columns, with the control matching the column's type: text search, dropdown, or range.
The two tabs are designed for different rhythms of work. Category filters preview live, so you can feel your way to the right slice. Advanced filters let you build up a precise multi-column query first and commit it in one go with Apply — the dialog tells you it is holding them until you do, so a half-built query never disturbs the list you are reading.
Build a condition by picking an attribute, an operator and a value. The
operators follow the shape of the data: contains, equals and is-empty checks
for text, a value picker for fields with a fixed set of values, and comparisons
— greater than, less than, equals — for numbers. Where a field takes several
values, type them as a comma-separated list; spacing and empty entries are
tidied up for you, so nginx, , apache reads as the two you meant.
Mesh also checks a new filter against the ones already applied and explains any contradiction in plain language — asking for a field to equal two different values, or to be both empty and non-empty, tells you so rather than silently returning nothing.
Active filters appear as chips you can lift off one at a time, and Clear all in the dialog resets the whole set. Filters stay applied as the data refreshes, so a view you have set up keeps working while you use it. If nothing matches, lift a chip to widen the view, or clear the set and start again.
Fields you can filter on include:
- Risk score and Risk tags, which let you cut straight to what needs attention without adding columns to the list.
- Asset, Status, Owner, Owning group, and Organization, shared across all three asset types.
- Version, Platform and Installed machines on the Software list; OS, OS version and Manufacturer on Machine; Installed on on Crypto. Each applies to its own asset type and is marked not applicable on the other tabs.
- Text fields such as Version and OS version match on contains, equals, matches one of a list, and is-empty checks. Pair two comparisons on Installed machines — greater than one value and less than another — to bracket a range and find software with unusually wide or narrow deployment.
- Signature algorithm and key size on the Crypto list. Key size is
offered under Public Key Algorithm and takes the size itself, such as
2048— which is the quickest way to gather every asset on a given key strength.
Your selections travel with you: filters set on an asset list carry into an asset's details page for the rest of your session, so opening a record doesn't lose the view you built. Filters you apply inside Correlated Assets are scoped to that section and kept separate, so narrowing a correlation view never disturbs the list you came from.
Asset details
Select an asset to open its details page.
How an asset is identified
Every asset carries at least one identifier. Which ones you see depends on where the asset's data came from, and the details panel shows only the set that applies:
| Field | When it appears | What it is |
|---|---|---|
| Mesh unique ID | Always | The stable identifier Mesh assigns to the asset |
| Mesh unique IDs | When one row stands for several collapsed records | The same field in plural. It reports how many records were collapsed together and lets you expand the list. It starts collapsed, and shows up to 500 identifiers |
| ServiceNow ID | Assets identified from your CMDB | The record's identifier in ServiceNow, alongside a link that opens it there |
| Package URL (purl) | Software that came from an SBOM | Standard package coordinates for the component — ecosystem, name, and version |
| SBOM Projects | Software and crypto that came from an SBOM | The project identifier your own SBOM tool assigned to the project this component was found in |
A Package URL, or purl, is an industry-standard way to name a software
package precisely enough to look it up. It reads as
pkg:<ecosystem>/<namespace>/<name>@<version> — for example
pkg:maven/com.example/billing-client@3.2.0 or pkg:npm/lodash@4.17.21. Mesh
displays whatever the SBOM declared, unchanged, so it matches the coordinates
your build tooling and vulnerability scanners use.
Cryptographic elements have no Package URL of their own — a certificate or an algorithm isn't a package. A crypto element's SBOM Projects value is therefore borrowed: it lists the projects of the software that uses that element.
Each asset shows one identity block, matched to how it was identified: SBOM identity for software with a Package URL and for cryptography inside a scanned project, CMDB identity for records identified from ServiceNow. The SBOM rows appear once there is a value to show; elsewhere a field with nothing recorded shows a dash, the same convention the list uses.
Why an SBOM project ID often looks like a random string
SBOM Projects frequently shows a long string of letters, numbers and dashes rather than a readable project name.
This is your own data, exactly as your tooling recorded it: the project identifier your SBOM-generating tool assigned, passed through unchanged so that it matches exactly what you see in that tool. Whether it reads as a name or as an opaque ID is decided by the tool that produced the SBOM, not by Mesh.
Because these values exist to be matched against your own tooling, the field is shown in a monospaced font with a copy button, and several IDs print one per line. Use the hide / show control beside the label to collapse a long list.
The Product field deliberately behaves the other way around: it is meant to name a product, so a value that is only an opaque identifier is hidden there and the field shows a dash instead.
Risk score breakdown
Point to the asset's risk score to see what it reflects. The tooltip opens with "The asset's score reflects:" and then shows the detail that suits the asset type:
- On Software and Crypto, the asset's own risks grouped by severity, each with the score it contributes — for example, "PQC noncompliant (40)".
- On Machine, a line per direct risk category with its count — for example, "Risks associated to this asset: No owner (3)" — together with a summary of risk inherited from correlated assets, such as "Risks inherited from 38 correlated assets (190)". A machine carries the risk of what runs on it, so its score is read that way.
Severity is conveyed by the color of the score. The same tooltip appears on the asset list and on the asset details page, so a score means the same thing in both views.
The Risks section
The Risks section of the asset details page explains each risk tag on the asset:
- Simple risks state the condition plainly — for example, "This asset has no assigned owner" or "This asset is not linked to any hardware asset."
- Policy-based risks, such as noncompliance with a post-quantum cryptography (PQC) policy, show the outcome of the policy assessment, the specific attributes that didn't comply, and the name of the policy that triggered the tag.
Each tag opens its own explanation. Long explanations open in a dismissible dialog, and if risk data is missing for an asset, a generic explanation is shown.
Certificate details
For crypto assets, the details panel adds five fields:
| Field | What it shows |
|---|---|
| Signature Algorithm | The signing algorithm combined with the hash, such as RSA-SHA256 |
| Public Key Algorithm | The public-key algorithm combined with the key size, such as RSA-2048. The key size is part of this value rather than a separate field |
| Serial Number | The certificate's serial number |
| Issuer DN | The distinguished name of the issuing authority |
| Installed On | The machine the element was found on |
Serial Number together with Issuer DN identifies a certificate uniquely, which is what lets you match it to a record in an external system.
Correlated assets
Two assets are correlated when Mesh has established a relationship between them — a piece of software installed on a machine, a certificate used by a piece of software, or a component declared inside a project. The Correlated Assets section is where you see everything related to the asset you're viewing, grouped into Software, Crypto, and Machine tabs.
Correlation is the broader idea; the dependency graph is the narrower one. The graph draws only containment — what declares what, inside an SBOM. The correlated lists include relationships the graph never draws, which is why a machine appears here but never as a card in the graph.
The section is laid out like the main asset list:
- Sort and filter on all relevant columns, with pagination when an asset has many correlations.
- Correlated assets are grouped into Software, Crypto, and Machine tabs, with a filtered count reported for each tab — including tabs with zero matches.
- A Filters button next to the section header opens the same filter dialog you use on the main asset list. It shows only the categories that apply to the correlated types this asset actually has, drawn from the same five as the main list (Risks, Platforms, Owners, Organizations, Locations), so the choices stay relevant to what is in front of you. Active filters render as chips you can remove individually or clear at once.
- Filters applied here are scoped to the Correlated Assets section and kept separate from the main asset list filters. They persist as you switch tabs and as you move from asset to asset during the same session.
Rows here are grouped around the relationship you are exploring rather than around the whole estate, so a component can read as one row here and as several on the main list. Both views are accurate — they answer different questions.
The dependency graph
For assets that came from an SBOM, a List | Graph switch appears above the Correlated Assets section. The graph draws the same relationships as a diagram, so you can see where a component sits in your software supply chain.
The switch appears only when the asset actually has SBOM relationships to draw. On an asset with none, the section stays a list — there is no empty graph to open.
What the nodes are. Each card is one software component or one cryptographic element. Machines never appear: a machine runs software, which is an installation, not a dependency. Each card shows the component name, its version, and its risk score, with a colored left edge matching the score. Point at a card to see its Package URL and publisher.
| Marking on a card | Meaning |
|---|---|
| Blue outline with a glow | The asset you're currently viewing. It stays put as your reference point while you explore around it |
| Blue P badge | A top-level SBOM project |
| Purple ×N badge | N occurrences of the same component were folded into this one card |
| Red warning icon | Something here needs post-quantum attention — either this element's own algorithm, or one below it in the tree. Following the marked cards downward leads you to the element responsible |
Mesh judges post-quantum compliance from the cryptographic strength reported for an element. Where a scan reports an algorithm Mesh cannot positively confirm as quantum-safe, it marks the element not compliant rather than compliant. Nothing is shown as safe on the strength of an assumption.
A red marker is therefore a prompt to look, and in the graph it covers three cases worth telling apart: an algorithm known to be vulnerable, one whose strength your scan did not report, and a component marked because something beneath it carries one of the first two. That last case is what makes the marked path worth following — it leads you from the component you were looking at to the element actually responsible. Enriching the algorithm detail your SBOM emits will resolve the second group and sharpen the picture.
What the lines mean. A line means containment — the component above contains the one below, following the structure your SBOM declared. Direction runs top to bottom. The lines carry no other meaning, so a line is never a statement about traffic, trust, or calls between components.
Why the graph starts collapsed. A real dependency tree is far too large to read at once, so Mesh hides everything that isn't relevant to risk and folds the rest into labeled gray blocks you can open:
| Block | What it holds |
|---|---|
| N compliant components | Components that are compliant, along with everything beneath them. Mesh draws a component in full when it — or something beneath it — needs your attention, so the tree stays focused on what to act on |
| Service layer | Intermediate consumers between a top-level project and the asset you're viewing. A project that uses the asset directly keeps its own line rather than being routed through the block |
| N unlinked components | Components that belong to the project but whose relationship to it your SBOM did not declare. Mesh keeps them visible here rather than dropping them, so nothing from the scan goes unseen |
Select a block, or use the toggle chips above the graph, to expand it. Chips are the only way to collapse a block again.
Controls. Zoom in and out, read the current zoom level, or select Fit to frame the whole graph. Ctrl (or Cmd) with the scroll wheel also zooms. Selecting any other card navigates to that asset, keeping the graph view. The graph is fully keyboard-navigable: arrow keys move between cards, Enter or Space opens one, and Escape dismisses a tooltip.
Versions in tenant. For software, a side panel lists every version of this component present in your tenant, each with its risk level, a count of records carrying that version, and a marker on the one you're viewing. Select a version to jump to it.
Large trees. A graph draws up to 6 levels and 400 cards, which keeps it readable on the deepest real dependency trees. Past that, Mesh tells you the view has been trimmed and points you at the component itself, where its own tree starts fresh from the top — so you can always walk a large estate in readable steps.
Risk tags
Risk tags label the individual risks on an asset:
- A tag names the risk only — "PQC noncompliant", not "PQC noncompliant: Crypto". The asset type is shown elsewhere on the page.
- Hover over a tag in the asset list for a summary tooltip. Open the full explanation from the Risks section on the asset details page.
- Examples of tags you might see include PQC noncompliant, No owner, No linked asset, and Insufficient information. The exact set depends on the risk conditions Mesh detects and the risk policies configured for your organization. For questions about policy configuration, such as PQC compliance policies, contact your Axiad representative.
Take action from asset details
The asset details page offers two actions:
- Delegate investigation — assign an asset's investigation to a teammate. This is coming soon, and the control on the page tells you when it's ready to use. For how delegation works across Mesh, see Delegate remediation.
- View in ServiceNow — open the matching record in ServiceNow in a new tab, taking you straight to the CMDB entry behind the row. It appears on assets carrying ServiceNow identity, where there is a record to open — see How an asset is identified. If your tenant hasn't been set up with the ServiceNow integration yet, the button says so.
Export asset data
You can export from any asset screen. If no filters are active, the export starts immediately and covers everything. If you have filters applied, Mesh asks you to choose:
- All data — exports the full dataset, regardless of any active filters.
- Filtered data — exports only the records matching your active filters, so the export reflects exactly what you filtered for on screen.
Exports and downloaded files always use UTC timestamps, regardless of your tenant's timestamp display setting, so shared data stays consistent. While an export is running, the button shows it is working, and Mesh keeps tracking the job in the background — carry on reading the list, and the file is ready as soon as the job finishes.
For more on report generation and export formats, see Reports and exports.