Drill-downs & more panels
Selecting a row, a bubble, a tile, or a node in any workspace opens a focus view — a full-screen page about that one thing, assembled from the panels that make sense for it. You do not place these panels yourself — Mesh assembles the right set for whatever you opened. Your browser's Back button and the Esc key both step you back one level.
A focus view is as workable as the canvas it came from: its tables carry their own search, sort, filters, column choice, and Export. See Working with widgets.
Drilling into an identity
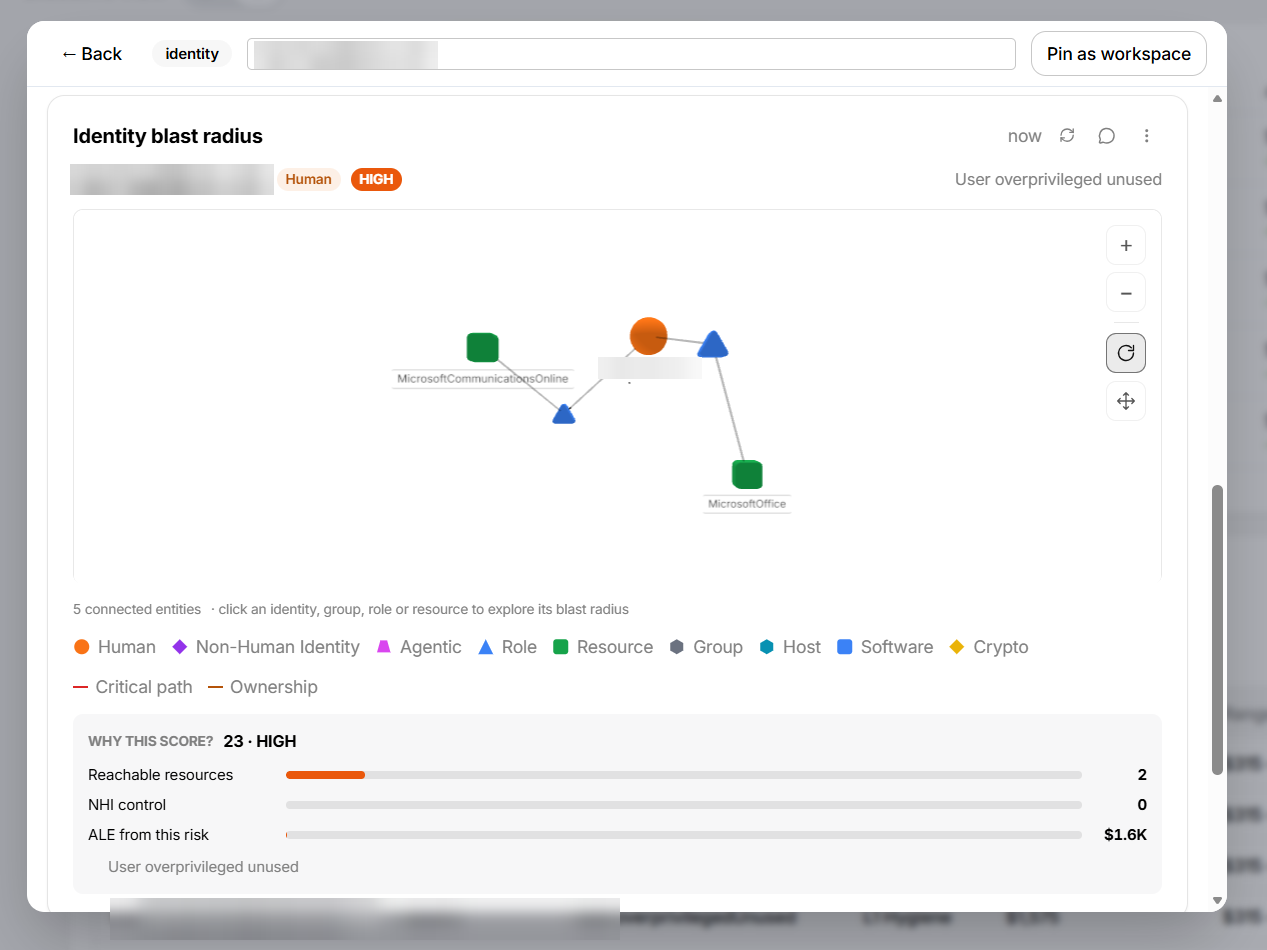
Selecting an identity — from the Top 10 riskiest identities, the risk cluster, or any list — opens its blast radius: the identity's connections two hops out (direct access, then what that access reaches), why it scored the way it did, and a ready-made prompt to hand the finding to the agent for remediation.
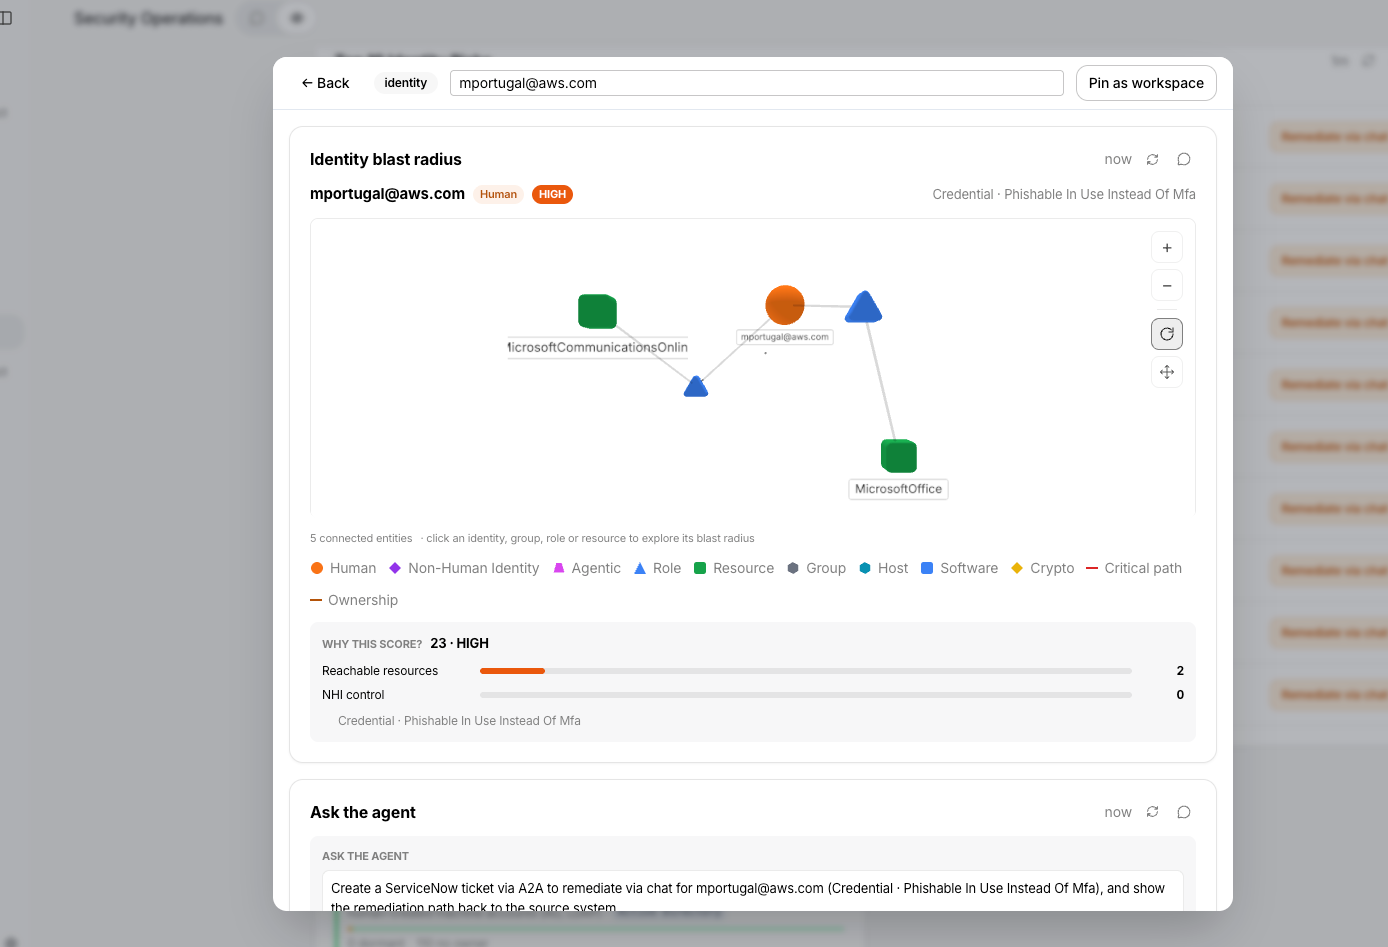
The panels that can appear in identity and finding focus views:
| Panel | What it tells you |
|---|---|
| Identity summary | The orientation card — who this is, their state, data quality, risk, and exposure. Read it before anything else in the view. |
| Identity risks | What is open against them, weighted by how confident Mesh is — so a near-certain medium can outrank a speculative high. |
| Identity graph | If this one is compromised, what else is exposed? Two hops out from the identity. |
| Identity list | Everyone in the population you selected, ranked by risk. |
| Finding header | Severity, exposure, and how long it has been open. A long-open critical is a process problem, not just a technical one. |
| Finding evidence | What Mesh observed, in the order it observed it. This is what you attach to a ticket or hand an auditor. |
| Remediation actions | The ordered steps that close it. |
| Affected identities | The blast radius of a single finding, as names. |
| Evidence timeline | When it started — usually the first question in any investigation. |
Drilling into a program
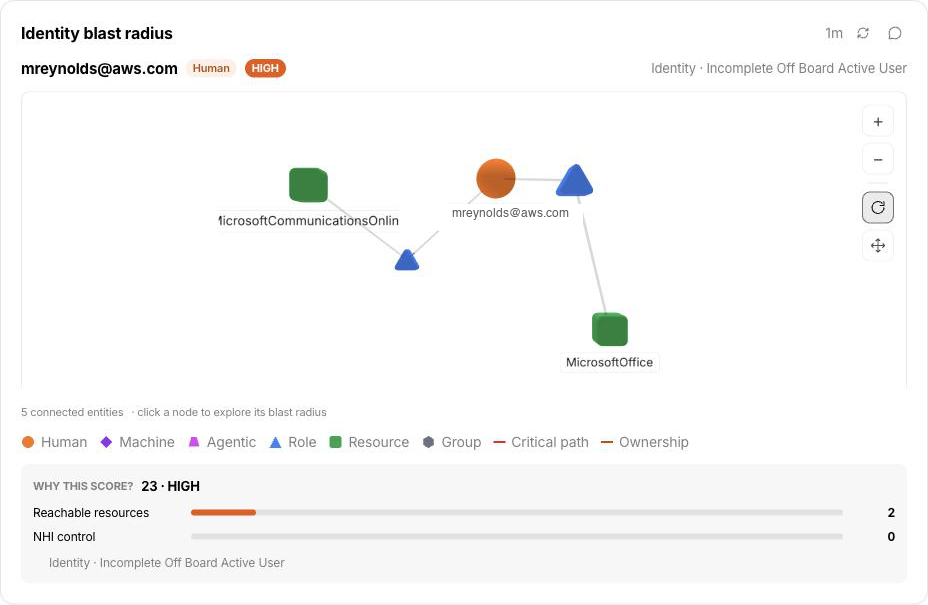
Selecting a program from the Programs panel opens its detail — status, progress, owner, deadline, and residual exposure — with a prepared question for the agent about what is blocking the next milestone.
Drilling into remediation impact
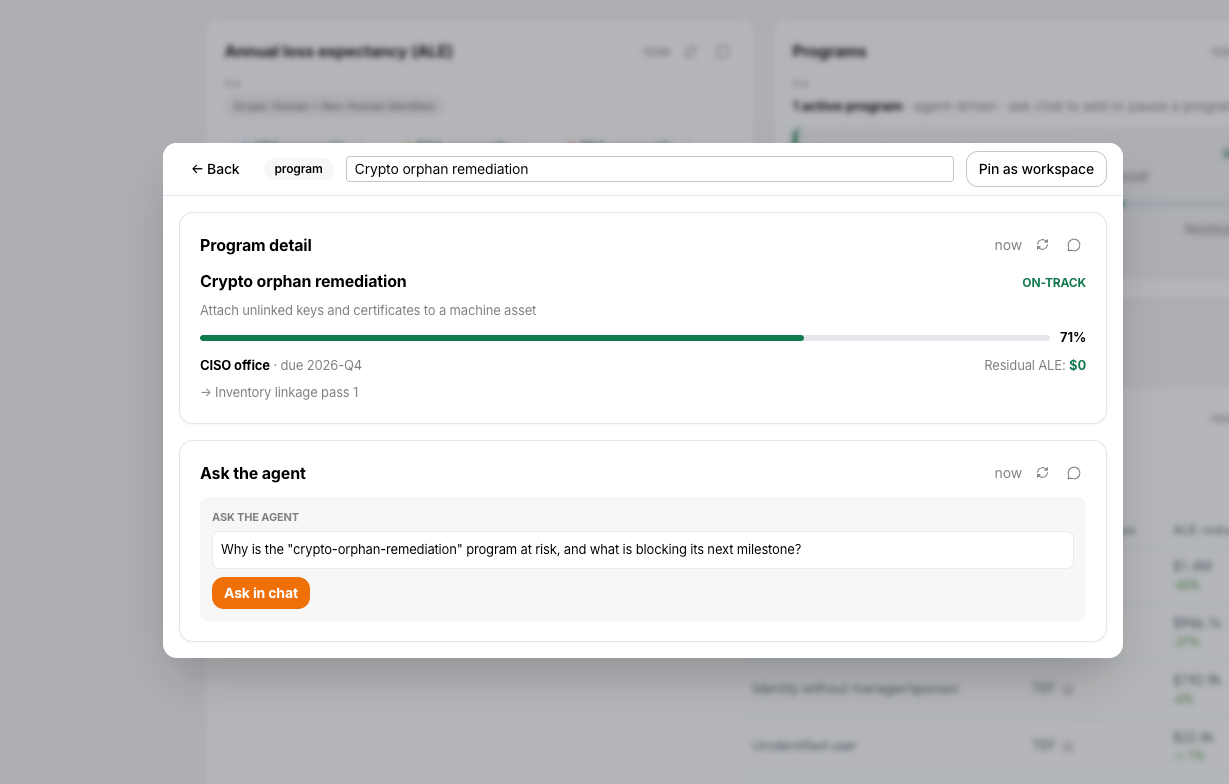
The Remediation impact widget ranks your top five risks by the annualized loss actually measured against them, and shows the assignment type behind each one. It drills three levels deep, so you can go from a dollar figure to the specific people carrying it without leaving the card.
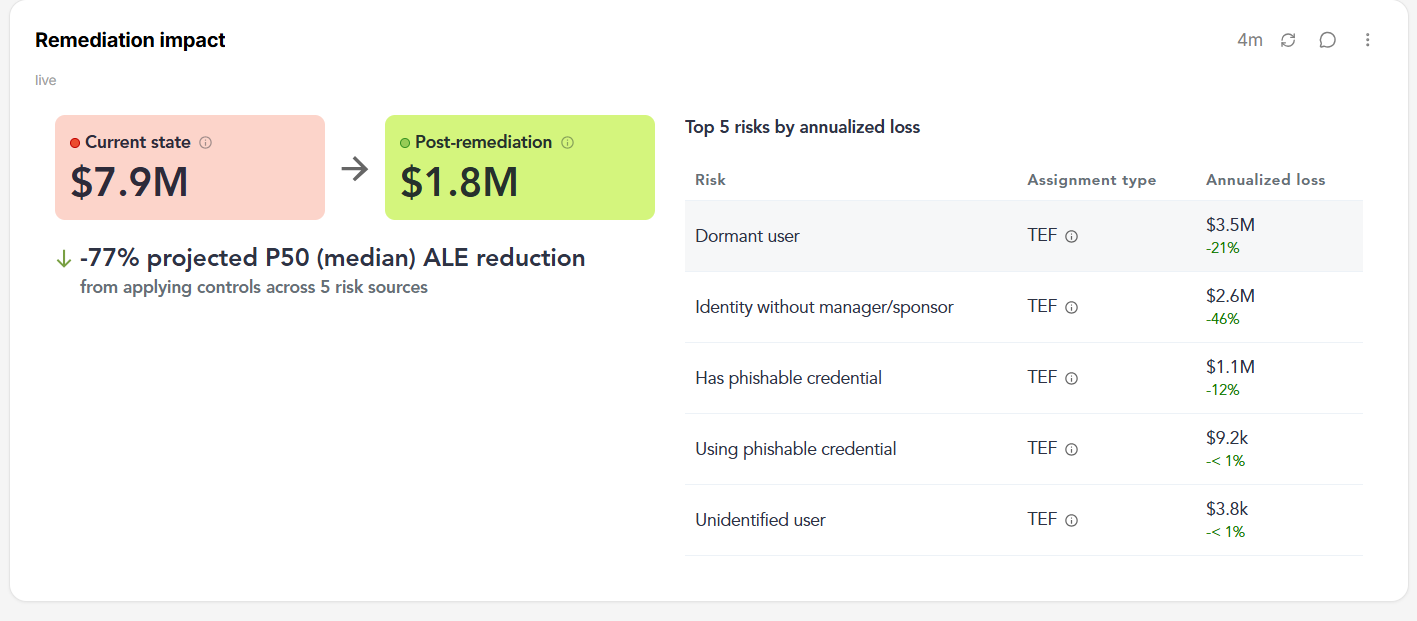
Level 1 — the ranked risks. The table is ordered by measured annualized loss, highest first, with the projected reduction beside each figure.
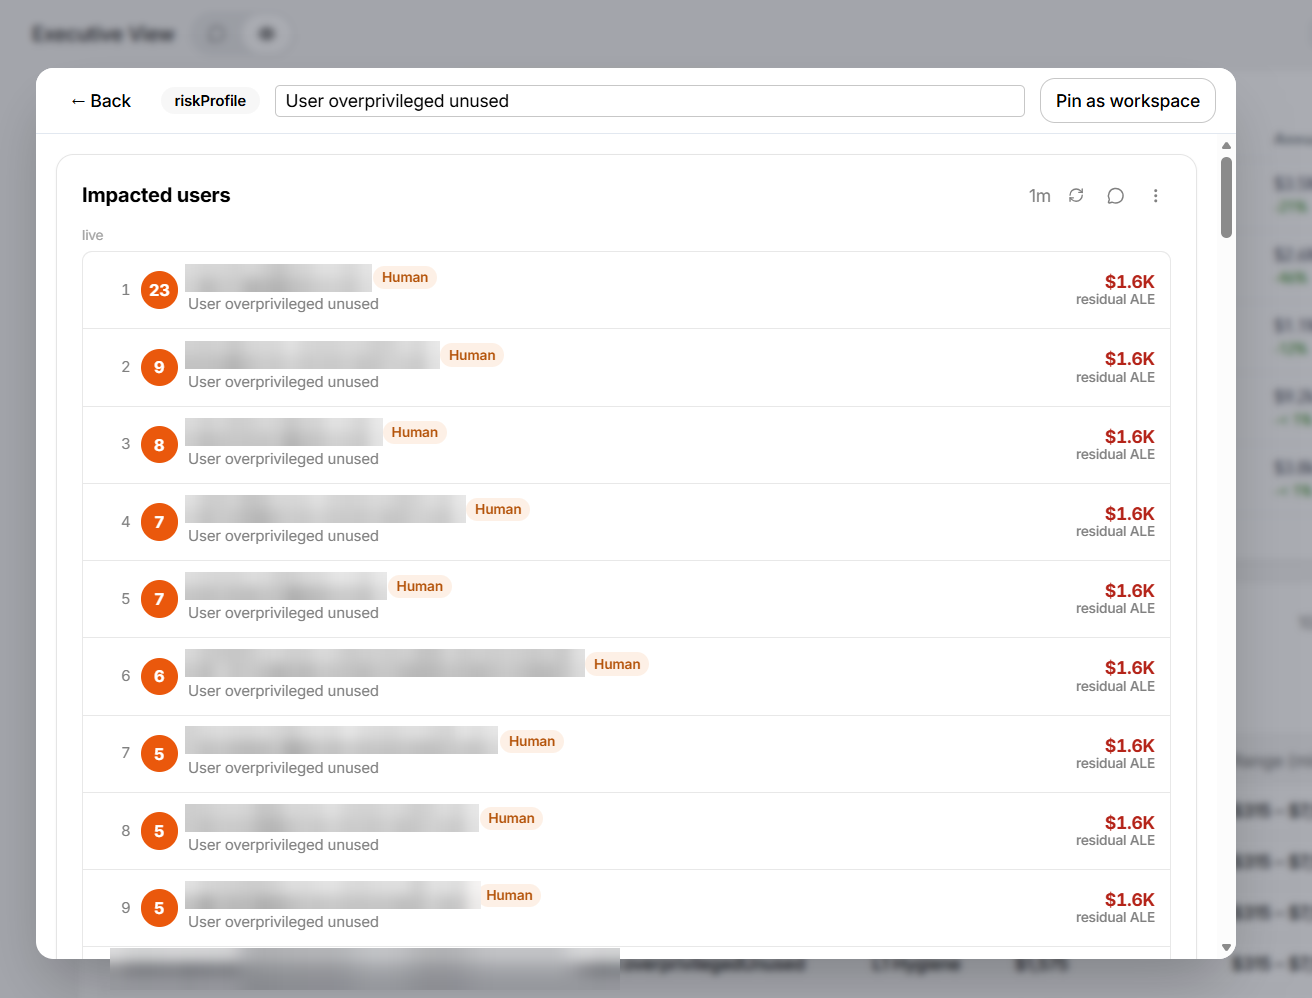
Level 2 — impacted users. Selecting a risk opens the identities that carry it, each with the residual loss scoped to that risk rather than to everything that identity carries. The list is paged, so a risk held by hundreds of thousands of identities shows you a page at a time rather than claiming a population it never fetched. Select Show more for the next page.
Level 3 — the identity. Selecting a person opens their profile — state, data quality, direct risk score, linked accounts, source, and manager — and their blast radius: the graph of what they can reach, with the score broken down into what drove it.
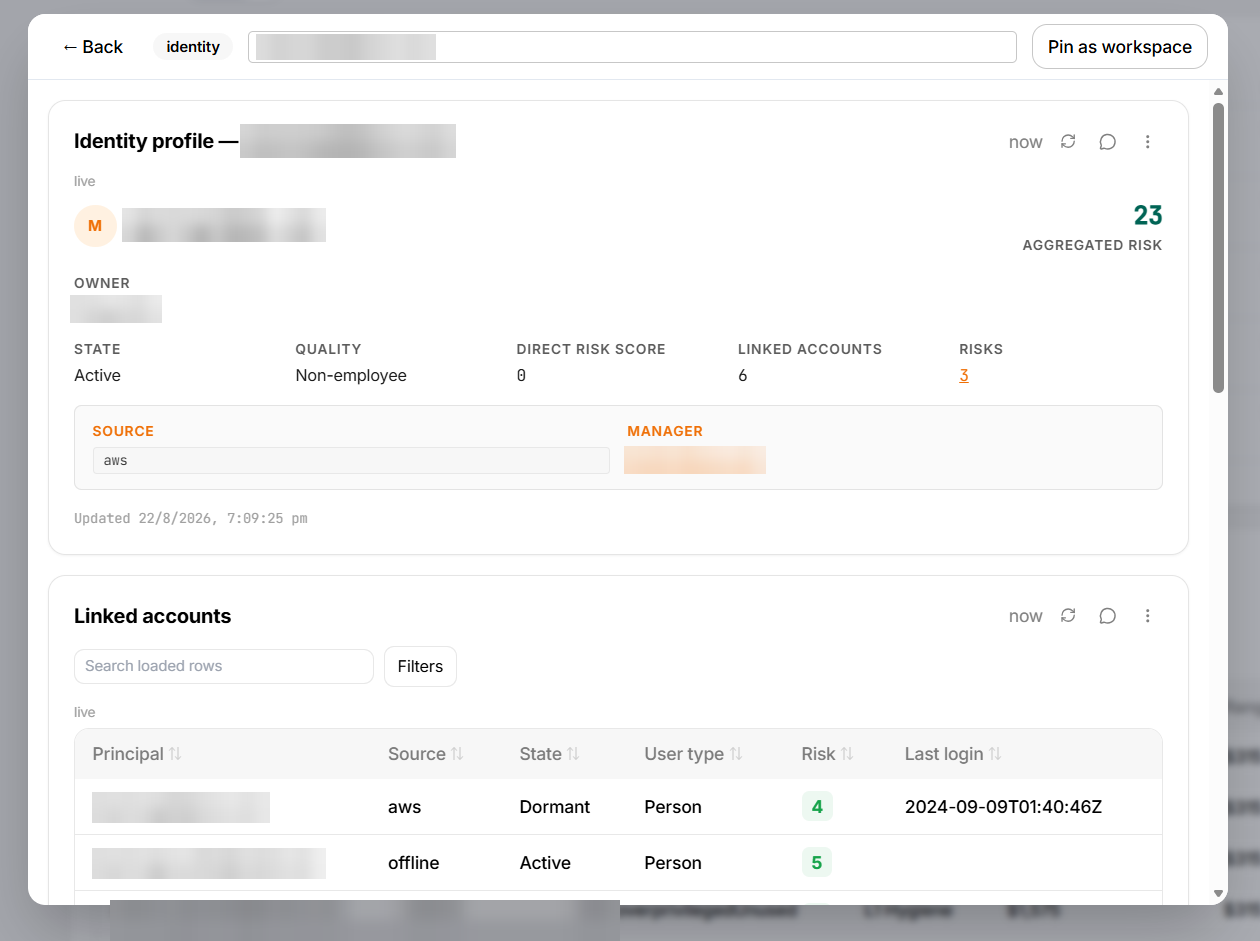
Role, manager, groups, and access appear on the profile only where your connected sources actually supply them. A missing row means Mesh has no value for it, not that the value is empty.
Drilling into the Algorithm Posture Matrix
Selecting a posture tile opens the algorithms that make up that category, how many assets use each one, and a paginated sample of the affected assets — see PQC Readiness.
More panels you can ask for
Beyond the four ready-made views, these panels can be composed into any workspace by asking for them:
| Panel | What it answers |
|---|---|
| Metric tile | What is the one number I care about? Ask for two or three to make a summary strip. |
| Remediation plan | If I can only fund three things, which three? Ranked by return, not by size — a cheap fix can outrank an expensive one that removes more. |
| Dark-web exposure | Have our credentials leaked? A match is an exposure signal, not proof of compromise — treat it as a reason to reset, not an incident on its own. |
| Historical snapshots | Is exposure actually falling? Watch the worst-case line specifically — a falling average with a flat worst case means tail risk is untouched, and tail risk is what insurers price. Plots the simulated series, and says so beneath the card. |
| Loss decomposition | What is the number made of? Fines, legal, and reputation usually outweigh your direct response costs, and are the least certain part. |
| FAIR decomposition | Show me the working. The panel for when your number is challenged — every figure traces back to its inputs. |
| Report header | As of when? Put it at the top of anything you export, so the numbers travel with their date. |
The panels that express risk as money use the open FAIR standard and read from your most recent completed risk report — they update when a new report is produced rather than minute by minute.
A second, separate set of money panels reads the measured figure stored on each individual risk instead, and updates continuously: ALE (measured), ALE by Layer, ALE by Identity Type, Top Risks by ALE, Top Identities by Loss Exposure, and ALE by Dimension. Like everything on this page they are not on any ready-made view — ask for the breakdown you want. See Per-risk loss exposure for what each one shows and how it differs from the simulated figures above.
Anything else
When the answer is simply a list and no purpose-built panel exists, ask for a table. Describe the rows and columns you want and Mesh will build one, which you can then sort and resize.
The machine-identity detail panels — asset summary, correlated assets, and asset risks — currently show representative sample data so you can evaluate the layout. They are not yet connected to your tenant. Do not use them for reporting or decisions. Every other panel on this page shows your own data.