Generative UI
Every dashboard you have ever used was designed months before you had your question. Generative UI turns that around: you describe the view you need, and Mesh builds it — a live, working set of charts and tables assembled around your question, in seconds, from the same data your classic dashboards show.
Start where you are:
- I want to try it — ask a question in your own words and watch a workspace assemble itself.
- Just show me something good — ready-made views for executives, auditors, security operations, and PQC readiness.
- How do I change what I am looking at? — working with widgets: searching, sorting, filtering, redrawing, exporting, and removing the panels on your canvas.
- What can it actually show me? — the per-view pages in this section list every widget with a screenshot: Executive View, Audit & Compliance, Security Operations, PQC Readiness, and drill-downs & more panels.
- Can I trust the numbers? — what it will and won't do.
The shift: From navigating dashboards to asking for one
Mesh has two modes, and a Classic | Agentic toggle in the header to move between them. Nothing you rely on has been taken away — Classic is the product you already know, unchanged. Agentic is a different way in.
| Classic | Agentic | |
|---|---|---|
| Getting to an answer | Find the dashboard someone built, then filter it toward your question | Type the question; the view is built around it |
| Who decides the layout | Fixed when the product was designed | Assembled for you, then yours to rearrange |
| Questions nobody anticipated | Export to a spreadsheet | Ask for exactly the view you want |
| Best for | Routine checks you do the same way every week | New questions, briefings, and one-off investigations |
The toggle is ordinary navigation. Your browser's Back and Forward buttons work, nothing is saved or switched on behind the scenes, and you can move between modes as often as you like. Use whichever fits the task in front of you.
Getting started: Your first workspace
A new workspace opens with a single question: What report do you want to generate? There is no menu to learn and no filter panel to configure.
- Say what you need, in your own words. "Compose a board briefing on our identity risk posture." "Where are our compliance gaps?" "Which identities should I worry about this week?" Full sentences are fine; so are three words.
- Watch it build. Placeholders appear immediately and fill with your data one by one. A short note in plain language explains each addition and why it earned its place — so you can judge the view, not just receive it.
- Adjust anything. Move a chart, resize it, change its filters, remove what you don't need, or ask for another panel in the same conversation. The composed workspace is a starting point, not a finished artifact.
Why it stays fast
The AI runs once, when it decides what to put on the canvas. Everything after that — refreshing a chart, opening a detail view, changing a filter — goes straight to your data with no AI in the loop. That is why a composed workspace behaves like a normal dashboard once it exists, and why two people with the same data permissions opening the same one see identical numbers.
When it asks before it guesses
Some requests genuinely mean more than one thing. "Show me our programs" could mean your security programs or your software inventory. "Graph" could mean the identity graph or a trend line. Rather than pick one and hope, Mesh stops and shows you the options as buttons:
- Which view do you mean? — two to four readings of your question, plus a Something else… box if none of them fit.
- Which chart do you want? — when your words map cleanly to more than one, it names the candidates so you can choose.
Nothing is composed until you answer, and your choice carries into everything you ask next in that workspace.
Shortcuts: Ready-made views
If you would rather start from something than from nothing, four views cover the most common roles. Each composes the same way every time, so you can put one on a screen in a meeting without wondering what you will get.
| View | Who it serves | What's on it |
|---|---|---|
| Executive View | Leadership | Posture and direction at board altitude — risk score, 90-day trend, today's briefing, loss exposure in currency, tracked programs, remediation impact |
| Audit & Compliance | Audit | Framework coverage, a control-category heatmap showing where gaps cluster, and a cyber-insurance readiness score |
| Security Operations | SecOps | The identity risk cluster, top findings, the identity exposure breakdown, and an inventory of the autonomous AI agents in your tenant |
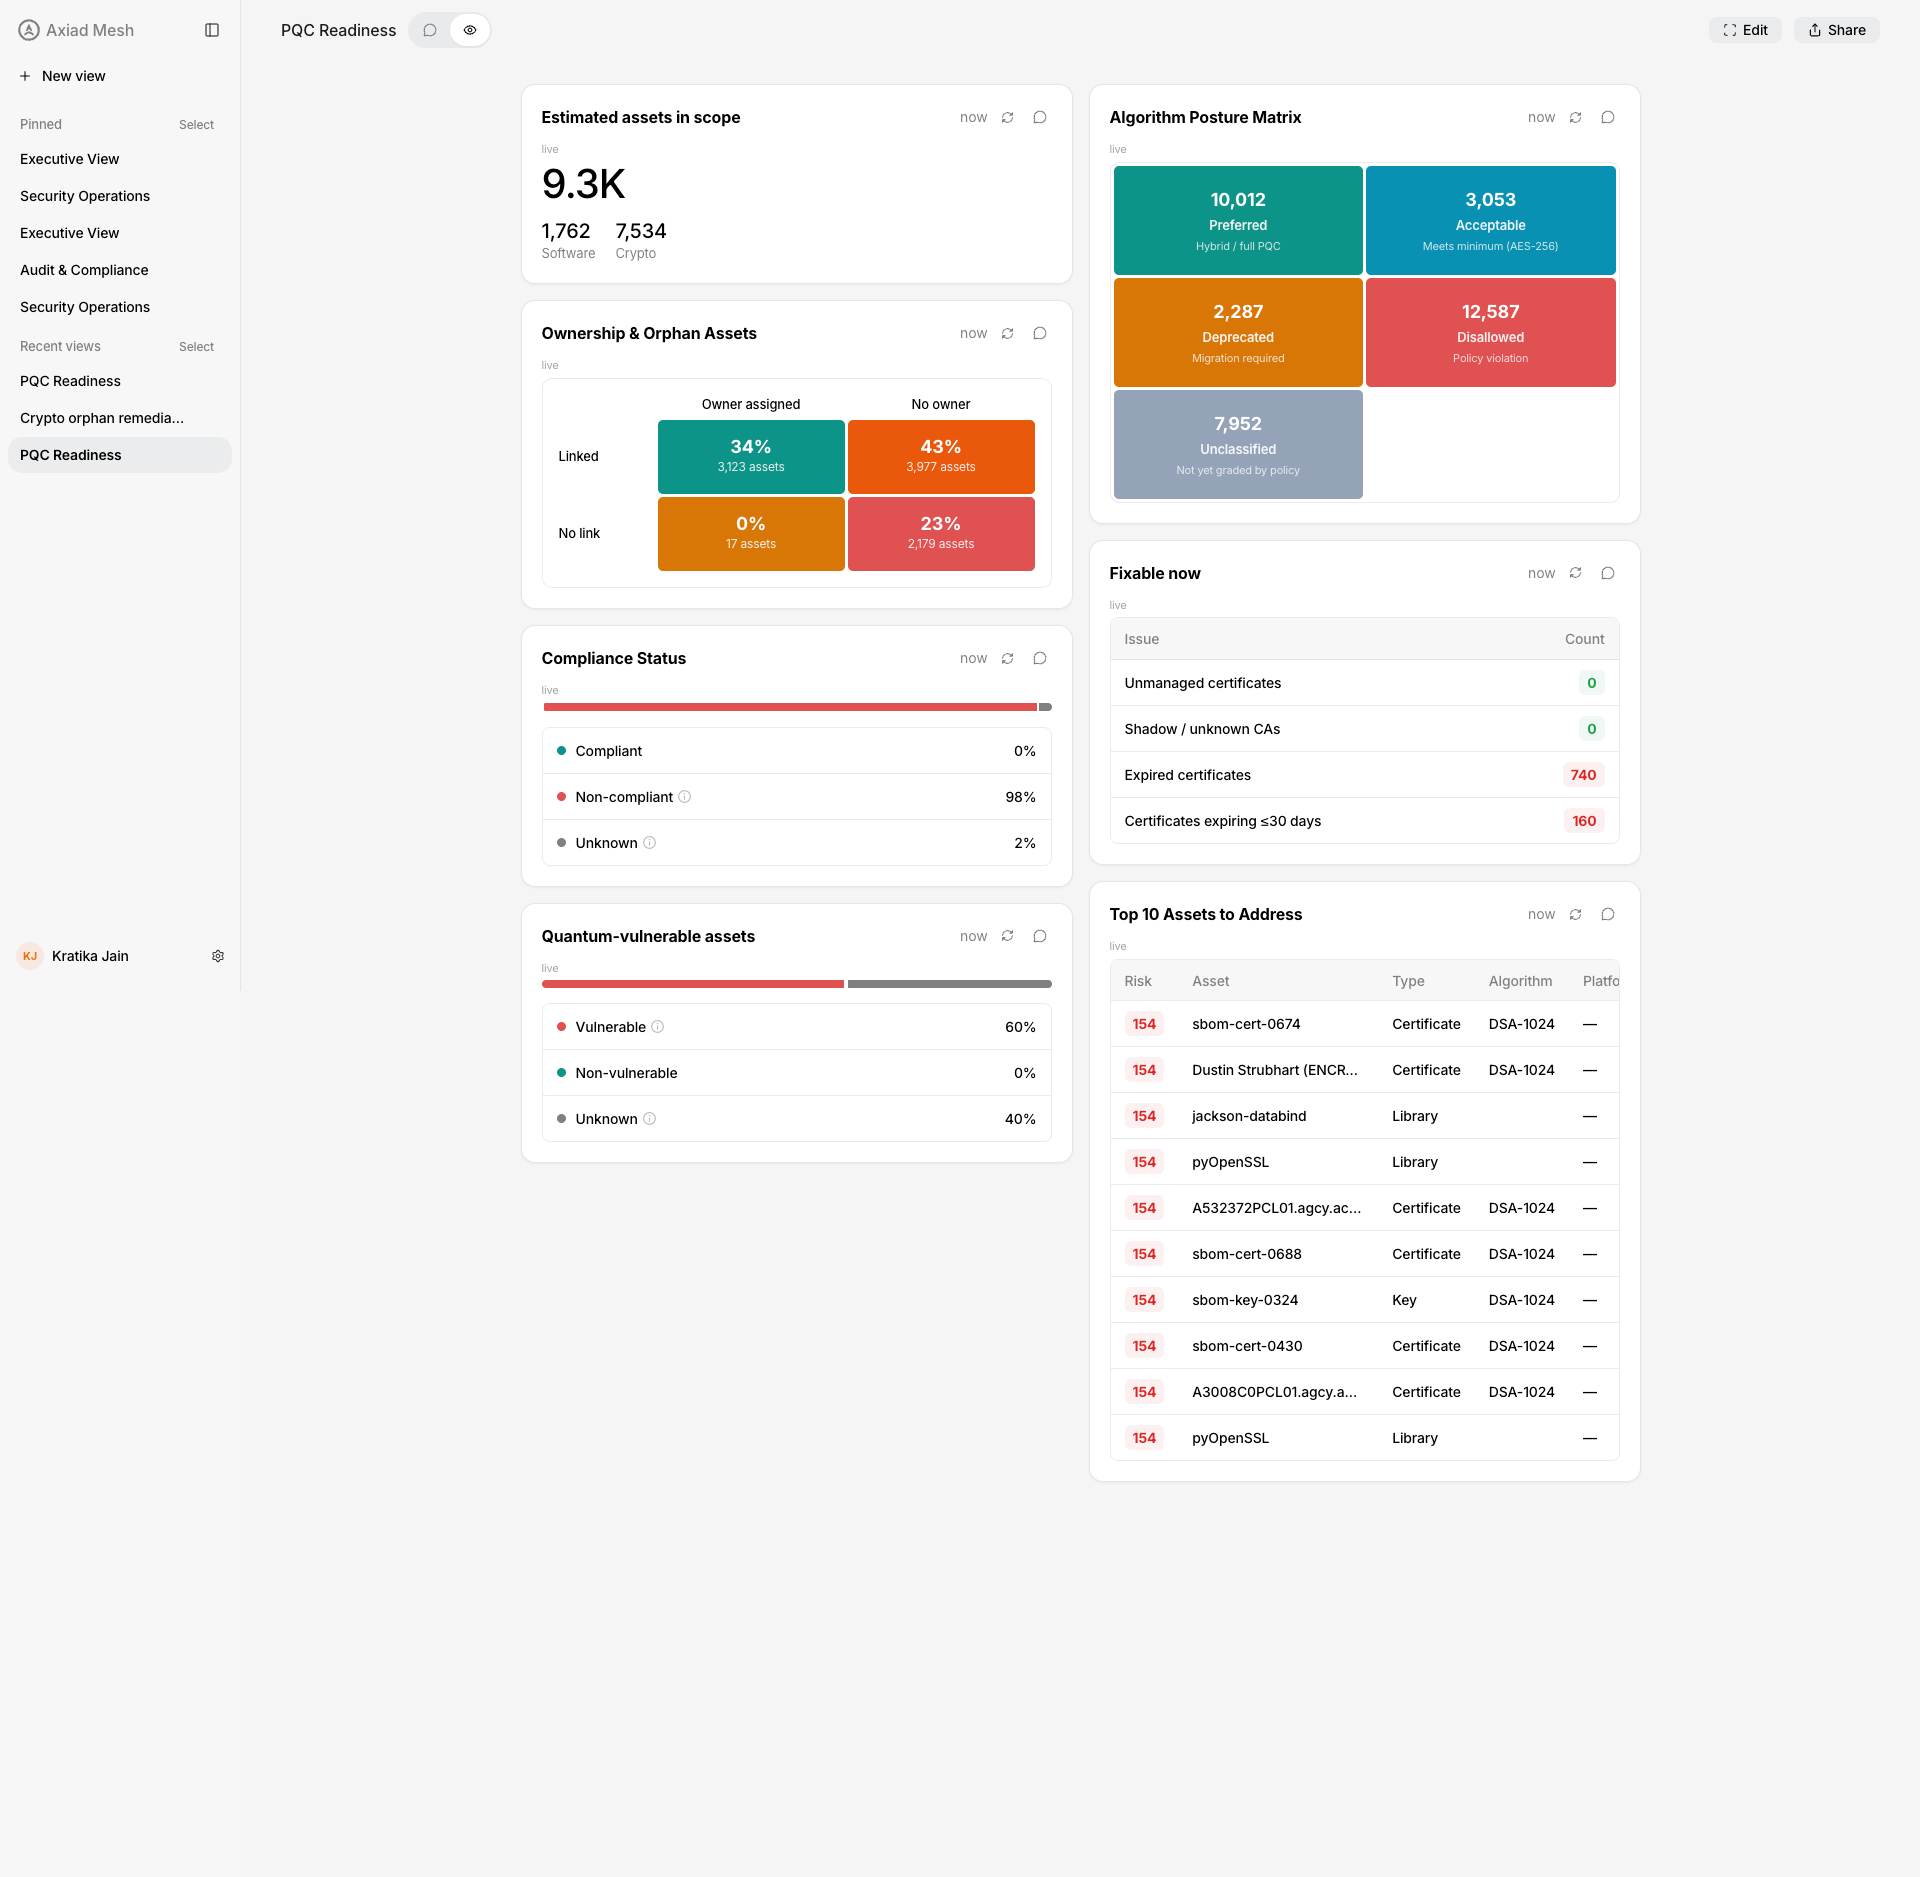
| PQC Readiness | Crypto / PQC program | Your crypto estate's post-quantum posture — asset scope, ownership, compliance, the Algorithm Posture Matrix, and what to fix first |
Each view's page in this section documents every widget with a screenshot.
Working with a workspace
Every widget is a working panel
A composed widget is not a fixed picture. A table widget carries its own search box, sortable headers and Filters control, and every widget's three-dot menu holds Edit — rename, resize, choose columns, change the display — along with Export, Share this widget, and Remove. The chat does the same things on request. See Working with widgets.
Click anything to go deeper
Selecting a row, a bubble, or a node opens a focus view — a full-screen page about that one thing, assembled from the panels that make sense for it. An identity gets its risks and its connections; a finding gets its evidence and its fix. Focus views stack, so you can follow a thread several steps and come back cleanly: your browser's Back button and the Esc key both step you back one level. See Drill-downs & more panels for what these focus views contain.
What refreshes, and what does not
A saved workspace re-runs its widgets' queries when you open it, so its figures move with your data. The exception is a widget built from a fixed set of rows — a chart composed from chat, for instance. That widget keeps the rows it was created with and redraws them; refreshing it does not fetch new ones.
There is no workspace-wide freeze. If the figures in a briefing need to stay exactly as you sent them, export the widgets you are citing rather than relying on the view looking the same when someone opens it later. See Working with widgets.
Ask for more at any time
A workspace is never finished. Ask for another panel in the same conversation and it joins the canvas beside what is already there — you do not have to start a new workspace to add to one.
Sharing and saving
Workspaces are saved automatically and listed so you can return to them.
To let a colleague see one, share it with them by email address — the whole view, from Share at its top right or from the ... beside it in the left panel, or a single widget, from that widget's own menu. Inviting somebody adds named people one at a time and never makes a view public. Widgets that run a live query show each person what their own permissions allow, so a shared workspace can legitimately look different to different people; a widget built from a fixed set of rows shows everyone the rows it was created with.
See Sharing a view or a widget.
Trust: What it will and won't do
Generative UI decides what to show you. It does not stand between you and your data, and it does not have an opinion about the numbers.
- Your data, or an honest blank. Every panel shows your real tenant data or says plainly that it has none. It will never fill a gap with invented or sample numbers.
- The numbers match Classic. Both modes read the same source. A figure that differs between them is a bug worth reporting, not a modelling difference.
- It cannot invent a panel or a query. Mesh places only panels that already exist and reads only through pre-approved queries. It never writes its own.
- Your permissions still apply. The agent cannot reach another tenant's data, or another user's data beyond what has been shared with you.
- Composition is recorded. What you asked and what was built are auditable, like any other action in Mesh.
Current limits
- A composed report holds up to five panels. Ask for "everything" and Mesh composes the five most important angles, then offers more in a follow-up.
- It composes from the widget catalog documented in this section. If the panel you want does not exist, the agent will tell you rather than approximate it.
- Some panels depend on data you may not have connected yet, or on a report that has not run. Those say so, and name what is missing.
Getting access
Agentic mode is enabled per tenant and is off by default while it rolls out. If the Classic | Agentic toggle is not in your header, your administrator can request it. Turning it on changes nothing about Classic, and nothing about your data.
Related:
- Risk scoring — how scores and loss estimates are produced
- Reports and exports — generating a FAIR risk report
- PQC dashboard — the classic crypto-vulnerable asset overview